Trends in Higher Education – Part 1
The sky-high cost of higher education.
In a previous essay series we looked at trends in K-12 education. In this series of essays, we’ll look at how those trends and others manifest themselves in higher education.
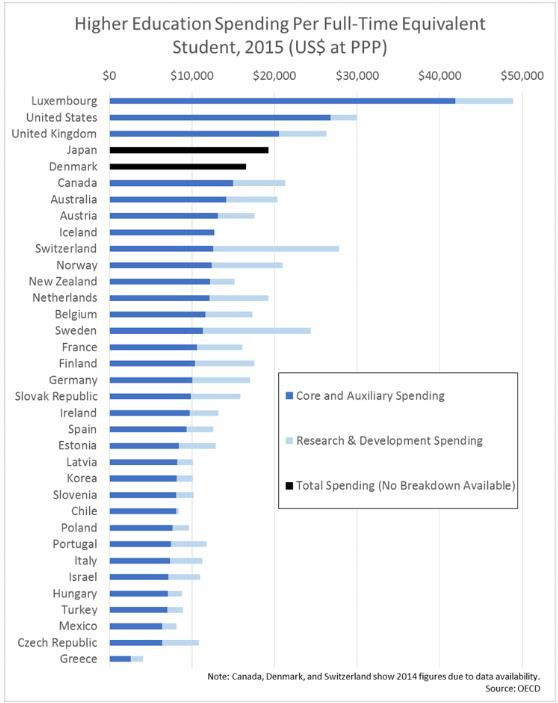
Data from the Organization for Economic Co-operation and Development shows that the U.S. spends more on higher education per students than just about all other economically developed states.
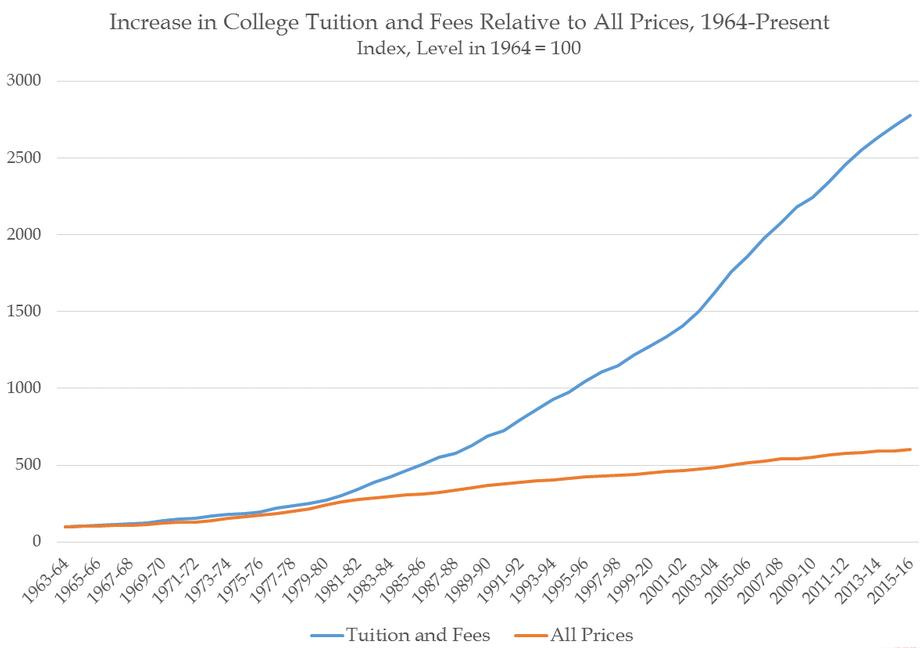
There has been a fourfold real increase in college tuition over the past half-century.
As one observer has pointed out:
How can you possibly justify a $200,000+ college expense? How can you justify a $100,000+ college expense? This is not necessary. The average tenure hopeful adjunct makes $40 an hour. If you were to employ her as a private tutor at the cost of $60 an hour, and had four hours with her a week, and did that for 14 weeks (that’s the length of an average college course folks) that is about $3,400. Were you to employ three such professor-tutors, that would be about $10,200, or a bit over $20,000 a year. In four years you would have racked up $80,000 in costs. But this is still $30,000 less than the total for the ‘cost conscious’ universities. It is a quarter of what you would pay for Trinity. Remember: this $80,000 is for private tutoring, where individual attention would give you far and away a better and more thorough education than the 300-kids-in-a-lecture-hall style of classes that dominate undergraduate education today. But it can get even cheaper. Let’s say you take the general principle of group classes from the university. Say you can find four other people to take all of these other classes with you. Just four. Well that equals out to $680 per class, or $16,000 a person for four years of classes. To be fair, add in $1,000-$2,000 for textbooks and a subscription to JSTOR [Journal Storage, a digital library], for a total of about $17,000 to $18,000 for four years.
Researchers found that college students’ experience learning remotely during the COVID pandemic dramatically changed their perception of how much they’d be willing to pay to back to in-person learning on college campuses. As they report:
The college experience involves much more than credit hours and degrees. Students likely derive utility from in-person instruction and on-campus social activities. Quantitative measures of the value of these individual components have been hard to come by. Leveraging the COVID-19 shock, we elicit students’ intended likelihood of enrolling in higher education under different costs and possible states of the world. These states, which would have been unimaginable in the absence of the pandemic, vary in terms of class formats and restrictions to campus social life. We show how such data can be used to recover college student’s willingness-to-pay (WTP) for college-related activities in the absence of COVID-19, without parametric assumptions on the underlying heterogeneity in WTP. We find that the WTP for in-person instruction (relative to a remote format) represents around 4.2% of the average annual net cost of attending university, while the WTP for on-campus social activities is 8.1% of the average annual net costs. We also find large heterogeneity in WTP, which varies systematically across socioeconomic groups. Our analysis shows that economically-disadvantaged students derive substantially lower value from university social life, but this is primarily due to time and resource constraints.
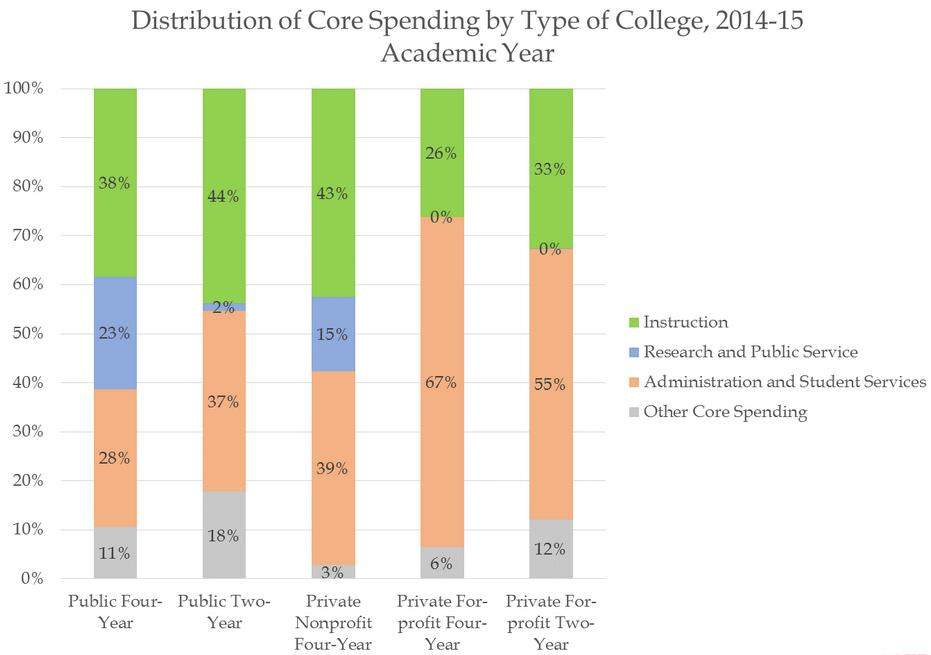
This rise in college tuition costs well beyond prices for everything else is driven by increases in spending on administrators and students services.
As U.S. News reports:
The gap between what U.S. colleges spend on teaching versus administrative support has steadily closed over the years, according to data provided to U.S. News by the National Center for Education Statistics. At public four-year schools in 2010, 32.1% of expenditures were for instruction and 23.7% were for academic support, student services and institutional support. In 2021, instructional spending had decreased 4.7 percentage points to 27.4% of total expenditures while spending on academic support, student services and institutional support dropped less than 1 percentage point, to 22.9%. The change was more dramatic at private, nonprofit four-year schools. In 2010, 32.7% of expenditures were for instruction and 30% were for academic support, student services and institutional support. The dominance flipped in 2021, with instruction declining to 29% of expenditures while academic support, student services and institutional support accounted for 29.6%.
A nationally representative sample of roughly 900 “student-facing” administrators (those whose work concerns the quality and character of a student’s experience on campus) were surveyed and the results showed that liberal staff members outnumbered their conservative counterparts by a ratio of 12-to-one. Only 6 percent of campus administrators identified as conservative to some degree, while 71 percent classified themselves as liberal or very liberal.
Regarding my own alma mater, as a recent article noted, “Administrators now outnumber faculty at some universities—Yale employs 5,066 administrators and just 4,937 professors—and law schools haven’t been spared the bloat. Several law professors bemoaned the proliferation of diversity, equity, and inclusion offices, which, they said, tend to validate student grievances and encourage censorship.”
Administrators at Stanford University’s IT department published a long list of words as part of its Elimination of Harmful Language Initiative (EHLI). This list claimed it was harmful to say terms like “American” and “you guys.”
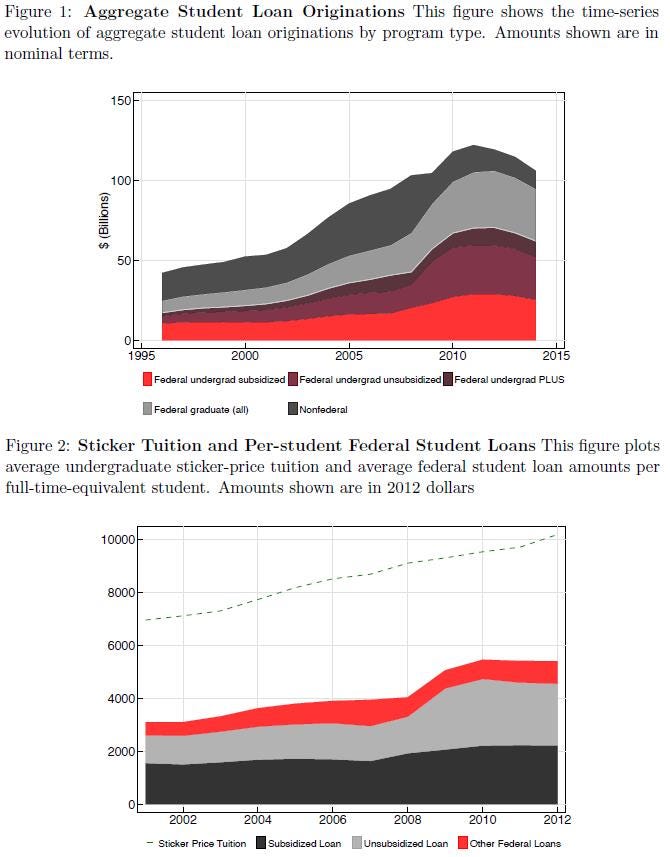
The federal government now directly supplies loans to students for higher education. As a result, universities have little incentive to lower costs, as researchers have found that “institutions charge tuition that is about 75 percent higher than that charged by comparable institutions whose students cannot apply for federal financial aid.” Consequently, universities have little incentive to lower costs. According to the College Board, percentage increases in the constant dollar published price for tuition, fees, and room and board at colleges have risen most dramatically since 2008, when the federal Ensuring Continued Access to Student Loans Act was enacted.
According to a Federal Reserve study, as student loans have become more readily available, tuition has increased accordingly, such that “institutions more exposed to changes in the subsidize federal loan program increased their tuition disproportionately around these policy changes, with a sizable pass-through effect on tuition of about 65 percent.”
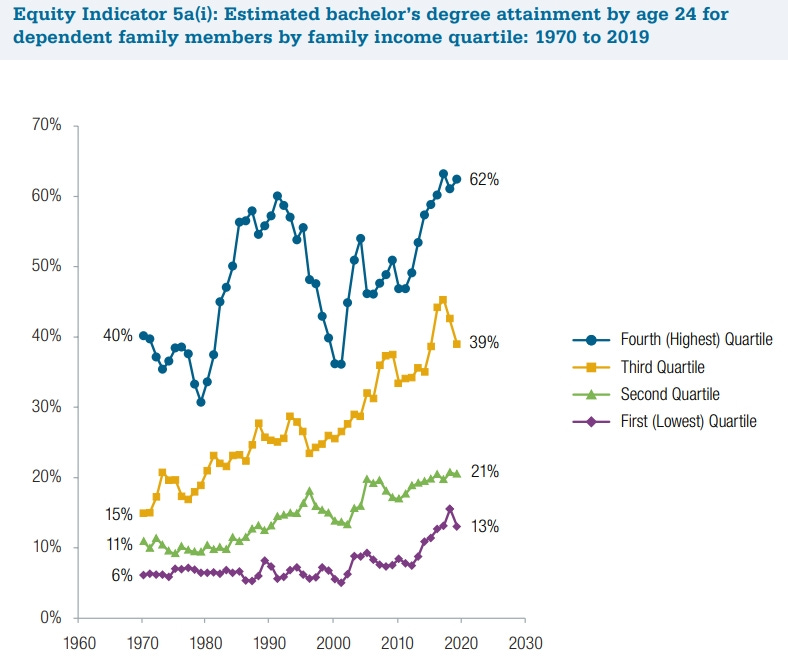
As tuition has increased, the gap between the number of college graduates from families in higher and lower income quartiles has increased.
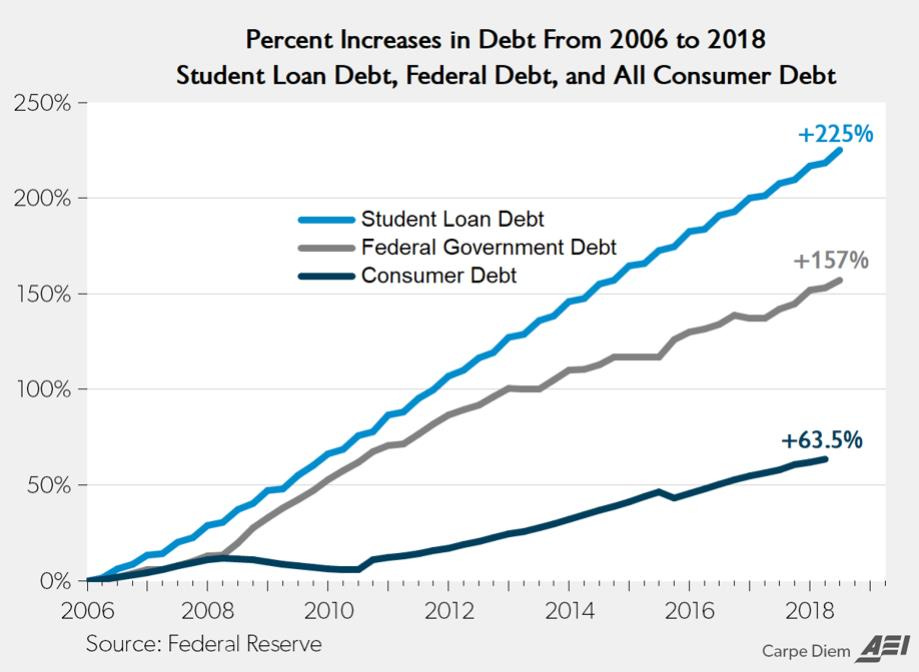
The growth in student loan debt has exceeded the growth in federal government debt and consumer debt generally.
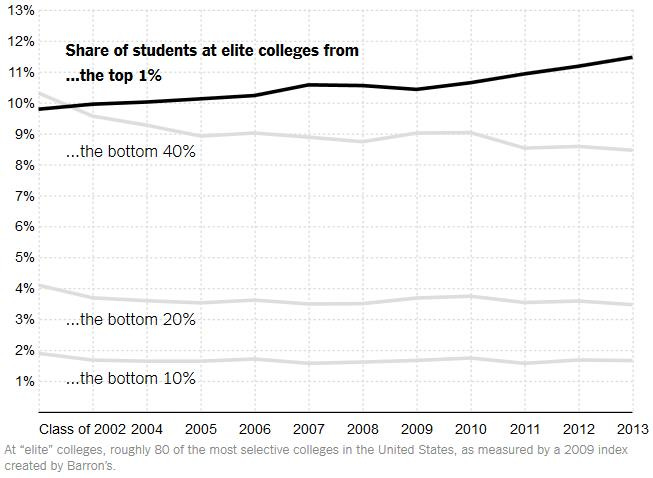
There are many more students at elite colleges from families in the top 1 percent of income than there are in the bottom 40 percent.
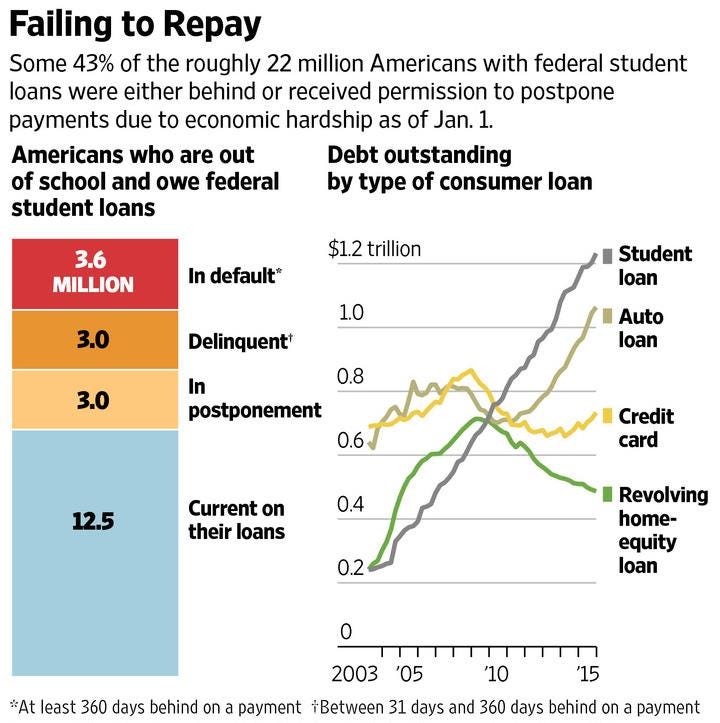
Students take out larger and larger educational loans that they increasingly cannot pay back, as evidence by larger and larger delinquency rates. In 2016, over 40 percent of those with federal student loans were either behind in their payments or got permission to postpone their payments.
A report from the Federal Reserve Bank of New York notes the disturbingly high delinquency rates on student loans compared to other types of debt. About 10% of the $1.5 trillion federal student-loan portfolio is 30 days or more past due. Another 20% is in deferment or forbearance, and about 30% is in income-based repayment plans that allow most borrowers to cap monthly payments at 10% of discretionary income and discharge the remaining balance after 20 years or 10 for folks in “public service. Using fair-market accounting that prevails in the private economy, the Congressional Budget Office projects a $306.7 billion cost to taxpayers over the next 10 years, and it will be worse beyond CBO’s 10-year budget window. As explained in the Wall Street Journal, “As long as borrowers are making de minimis monthly payments on student loans, their credit scores won’t be hurt. The upshot is that student-loan borrowers collectively are paying down a mere 1% of their balance each year, according to a recent Bloomberg News analysis. At this rate the U.S. Treasury’s existing student-loan portfolio wouldn’t be repaid for 100 years.”
In the next essay, we’ll look at how the cost of higher education lowers young people’s life prospects.
Links to all essays in this series: Part 1; Part 2; Part 3; Part 4; Part 5; Part 6; Part 7; Part 8; Part 9; Part 10; Part 11; Part 12

