Uncertain Climate Predictions and Certain Energy Progress – Part 5
More energy from less material.
In previous essays we looked at the uncertainties inherent in the computer models that purport to predict certain increases in world temperatures over the coming decades. In this essay, we’ll look at how clearly data show that, even as the demand for energy grows, human are getting much more by using much less resources.
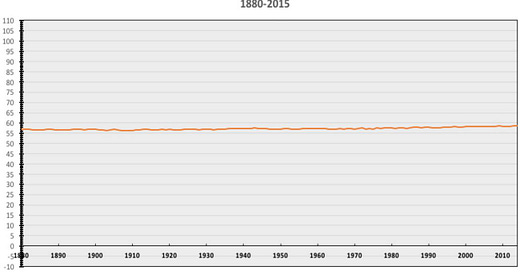
Average global temperatures have risen slightly over the last century.
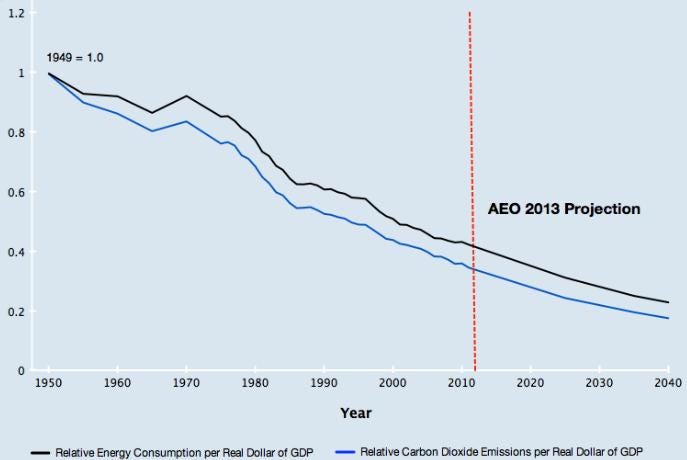
But even without mandated cutbacks on energy use, data from the U.S. Energy Information Administration’s Annual Energy Outlook (AEO) show that the United States has been consistently developing technologies that use less energy and emit even less carbon dioxide per dollar of gross domestic product over time. This has been the result of economic competition to find ways to use energy more cheaply, not government mandates.
Carbon dioxide emissions from electric power in the U.S. have fallen dramatically since 1984, mostly due to improvements in the process of fracking, which extracts natural gas from rock fissures, and natural gas is a relatively clean burning fuel. The chart on the left below shows CO2 emissions in the U.S. from the electric power sector for the first half of every year, which fell in 2019 to a 35-year low for the January-June period, the lowest since 1984. The chart on the right below shows the substitution of natural gas for coal, which now provides a record low 24% share of electric power in 2019 while the share of natural gas has increased to a record high of 36.6% in 2019 through June.
A 2020 Energy Information Administration report shows how fracking and competitive energy markets have done more to reduce CO2 emissions over the last decade than government regulation and renewable subsidies. According to the report, energy-related CO2 emissions in the U.S. fell 2.8% on 2019 as many utilities replaced coal and heating oil with less expensive natural gas. Hydraulic fracturing combined with horizontal drilling created natural gas production in the Midwest and Southwest that resulted in natural gas prices going down dramatically, putting many coal plants out of business. CO2 emissions from coal declined by more than 50% from 2007 to 2019, the report notes, and by 15% in 2019 alone. Between 2016 and 2019 the share of electricity generated by natural gas rose to 38.1% from 33.7% and by non-carbon generation (including nuclear and hydropower) to 38.2% from 35.5%. Coal generation during this period dropped to 23.3% from 30.3%.
Increasing power generation from natural gas has accounted for 60% of the country’s decline in CO2 emissions from electricity since 2010. The carbon intensity of the country’s energy declined at about the same rate during the first three years of the Trump Presidency as from 2009 to 2016. The International Energy Agency reported that the U.S. “saw the largest decline in energy-related CO2 emissions in 2019 on a country basis” due to a 15% reduction in the use of coal for power generation and “US emissions are now down almost 1 Gt [gigatonne] from their peak in the year 2000, the largest absolute decline by any country over that period.” (The CO2 reductions are so big that, while President Trump pulled out of the Paris Climate Accord and eased the Obama-Biden Administration’s climate regulations, the U.S. was still leading the world in CO2 reductions.)
Since 1970, the American population has grown, and consumption has grown even more as America produces more things, buys more things, drives more, and consumes more calories. But at the same time, free market incentives to reduce costs by reducing the use of resources has led to the use of less metal, the use of less fertilizer and fewer minerals, the use of less water, the use of fewer trees and paper, and less energy, and less pollution.
Andrew McAfee elaborates on these trends in his book More From Less: The Surprising Story of How We Learned to Prosper Using Fewer Resources – And What Happens Next. McAfee writes:
In recent years we’ve seen a different pattern emerge: the pattern of more from less. In America— a large, rich country that accounts for about 25 percent of the global economy— we’re now generally using less of most resources year after year, even as our economy and population continue to grow. What’s more, we’re also polluting the air and water less, emitting fewer greenhouse gases, and seeing population increases in many animals that had almost vanished. America, in short, is post- peak in its exploitation of the earth … The twin forces of tech progress and capitalism unleashed during the Industrial Era seemed to be impelling us in one direction: that of increasing human population and consumption while degrading our planet. By the time of the first Earth Day festival in 1970, it was obvious to many that these two forces would push us to our doom, since we couldn’t continue to abuse our planet indefinitely. And what actually happened? Something completely different, which is the subject of this book. As I’ll show, capitalism continued and spread (just look around you), but tech progress changed. We invented the computer, the Internet, and a suite of other digital technologies that let us dematerialize our consumption: over time they allowed us to consume more and more while taking less and less from the planet. This happened because digital technologies offered the cost savings that come from substituting bits for atoms, and the intense cost pressures of capitalism caused companies to accept this offer over and over. Think, for example, how many devices have been replaced by your smartphone.
Many people think Americans are consuming more resources and using up more energy to do it than ever before. But that’s not true. It seems counter-intuitive, but as McAfee writes, when resources become scarce, “scarcity causes prices to go up. As fertilizers, metals, coal, or other resources become more rare, they also get more expensive … What happened next was that the price surge activated human greed and combined it with human ingenuity. This combination of self-interest and innovativeness caused two things: a wide-ranging search for more of the resource, and an equally ardent search for substitutes. As one or both of these quests succeeded .., the original scarcity would be eased, and the resource’s price would go back down.”
Much of evidence that Americans are consuming fewer resources over time comes from the U.S. Geological Survey (USGS), a federal agency tasked by Congress with “classification of the public lands, and examination of the geological structure, mineral resources, and products of the national domain.” As McAfee writes:
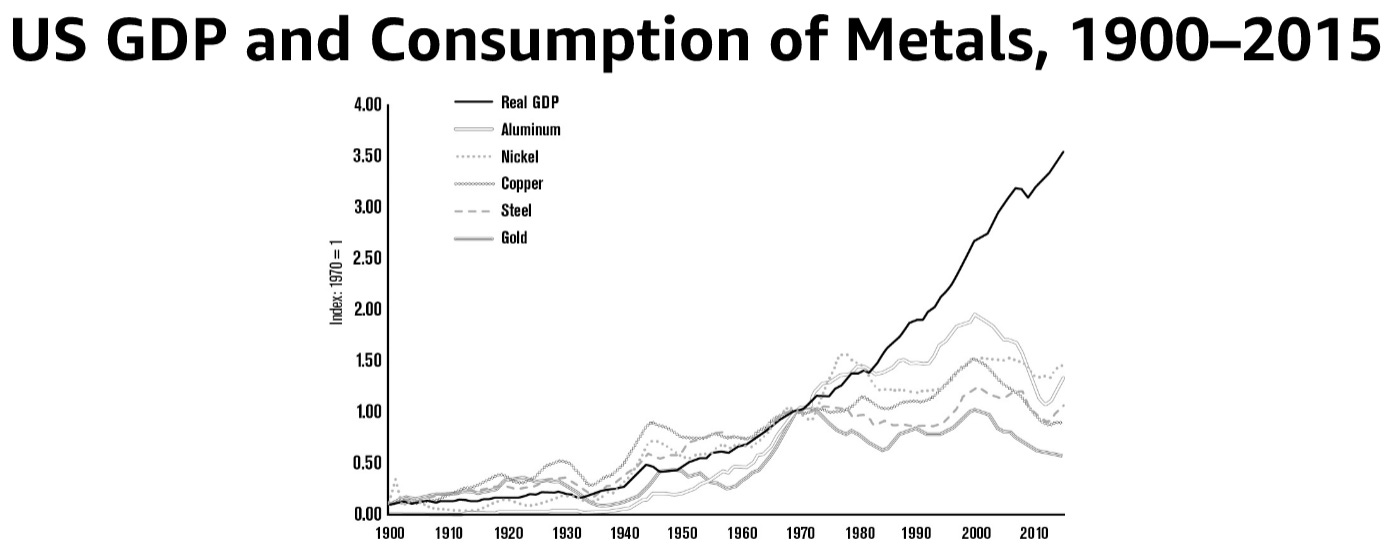
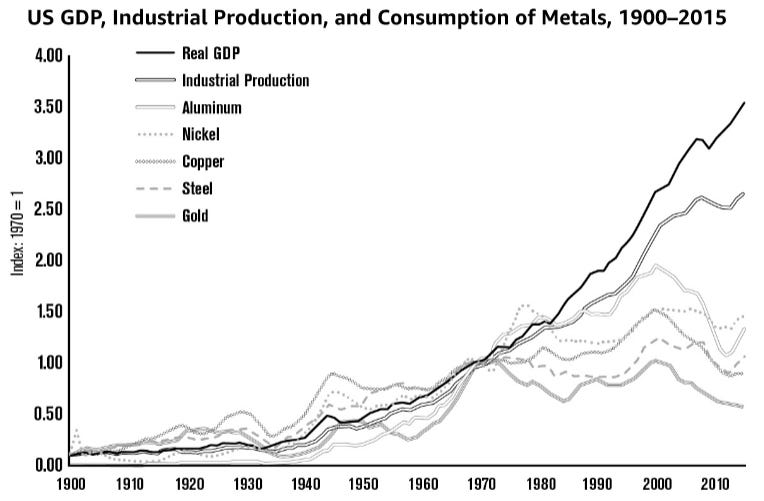
[S]ince the start of the twentieth century the USGS has been collecting data on the use of the most economically important minerals in America. Of particular interest is the survey’s yearly estimate of “apparent consumption” of each mineral. This consumption takes into account not only domestic production of the resource but also imports and exports. For example, to calculate America’s total apparent consumption of copper in 2015, the USGS would take the amount of copper produced in the country that year, add total imports of copper, and subtract total copper exports. The Survey’s data tell a fascinating story. To understand it, let’s start with metals, one of the most obviously important materials for any economy. Here’s total annual consumption from 1900 to 2015 of the five most important metals in the United States. A reminder: This is not annual consumption per American. This is annual consumption by all Americans— the total tonnage used year by year of these metals.
All of these metals are “post- peak” in America, meaning that the country hit its maximum consumption of each of them some years ago and has seen generally declining use since then. The magnitude of the dematerialization is large. In 2015 (the most recent year for which USGS data are available) total American use of steel was down more than 15 percent from its high point in 2000. Aluminum consumption was down more than 32 percent and copper 40 percent from their peaks. This dematerialization becomes even more impressive when consumption of resources in the United States is compared to the country’s economic growth. So here’s the same graph again with one more line added to it— US real GDP.
This graph clearly shows that a huge decoupling has taken place. Throughout the twentieth century up to the time of Earth Day, consumption of metals in America grew just about in lockstep with the overall economy. In the years since Earth Day, the economy has continued to grow pretty steadily, but consumption of metals has reversed course and is now decreasing.
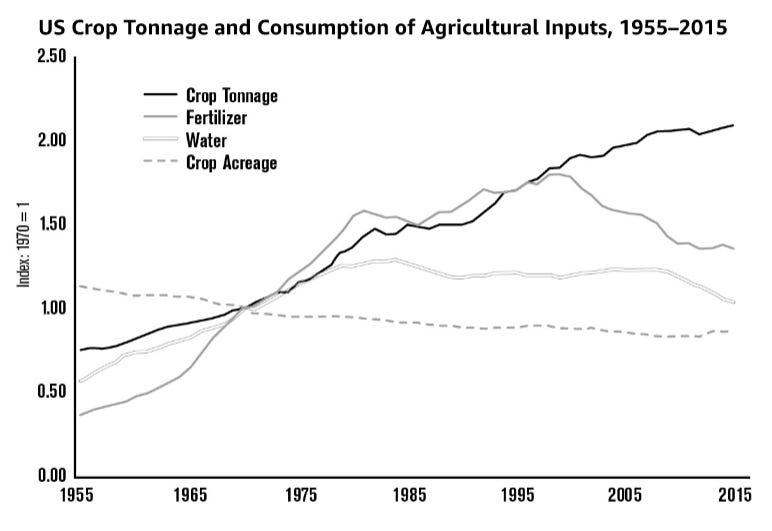
We’re now getting more “economy” from less metal year after year. We’ll see a similar great reversal in the use of many other resources. America is an agricultural powerhouse— the world’s largest producer of both soybeans and corn, and fourth in wheat. Fertilizer is, as we’ve seen, essential for growing crops. So here’s the country’s total consumption over time of fertilizer, water, and cropland. And instead of GDP, this graph charts total US crop tonnage.
Here again, output (crop tonnage) used to be tightly linked to inputs (water and fertilizer). But then that relationship changed, and we’re now getting more from less. Fertilizer use is down almost 25 percent from its 1999 peak, and by 2014 total water used for irrigation had decreased by more than 22 percent from its maximum in 1984. Total cropland has also fallen, to levels rivaling the lowest points of the previous century. Building structures and infrastructure requires a lot of resources, so let’s look at total consumption, according to the USGS, of the most important building materials. Let’s also include data on timber use from the US Department of Agriculture and throw in paper for good measure because it, like timber, is a forest product …
A final factor, though, was the ability to get ever-more corn, wheat, soybeans, and other crops from the same acre of land, pound of fertilizer and pesticide, and gallon of water. The material productivity of agriculture in the United States has improved dramatically in recent decades … Between 1982 and 2015 over 45 million acres— an amount of cropland equal in size to the state of Washington— was returned to nature. Over the same time potassium, phosphate, and nitrogen (the three main fertilizers) all saw declines in absolute use. Meanwhile, the total tonnage of crops produced in the country increased by more than 35 percent.
McAfee adds:
Are these graphs representative of what’s been going on in the American economy as a whole? They are. Of the seventy-two resources tracked by the USGS, from aluminum and antimony through vermiculite and zinc, only six are not yet post- peak. Of these, we spend by far the most on gemstones. We Americans apparently have a bottomless thirst for bling. If shiny ornamental stones are excluded from the analysis, then more than 90 percent of total 2015 resource spending in America was on post-peak materials.
And as resource consumption is down, energy consumption is down, too, which translates into lower greenhouse gas emissions. As McAfee writes:
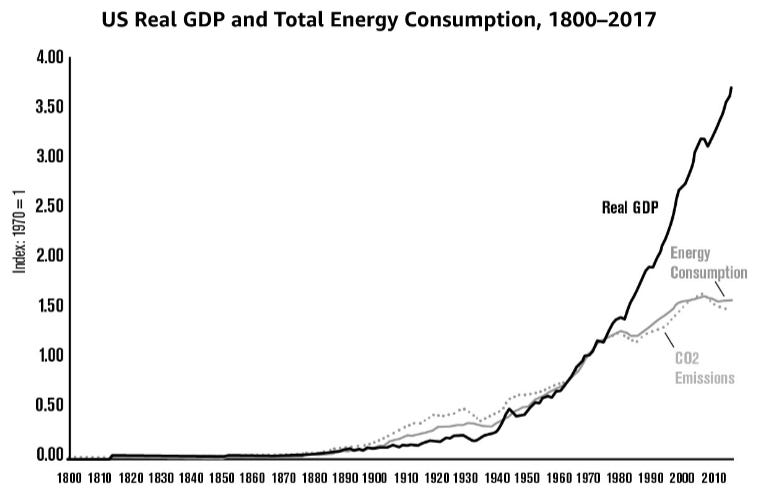
Finally, let’s look at total energy consumption combined with greenhouse gas emissions, which are the most harmful side effect of generating energy from fossil fuels.
I was surprised to learn that total American energy use in 2017 was down almost 2 percent from its 2008 peak, especially since our economy grew by more than 15 percent between those two years. I had walked around with the unexamined assumption that growing economies must consume more energy year after year. This turns out not to be the case anymore, and it’s a profound change. As we saw in the last chapter, energy use went up in lockstep with economic growth in America for more than a century and a half, from 1800 to 1970. Then growth in energy use slowed down, and then it turned negative— even as the economy kept growing. Over the last decade, we’ve gotten more economic output from less energy.
Greenhouse gas emissions have gone down even more quickly than has total energy use. This is largely because we have in recent years been using less coal and more natural gas to generate electricity … and natural gas produces 50–60 percent less carbon per kilowatt hour than coal does.
As McAfee points out, “We still make lots of vehicles, machinery, and other big- ticket items, just as we used to,” but at the same time “we don’t make them the same way we used to. We now make them using fewer resources. To see this, let’s add a line showing US industrial production to our graph from the previous chapter of GDP and total metal consumption. This updated chart makes clear that the country hasn’t stopped producing things. Instead, America’s manufacturers have learned to produce more things from less metal.”
So we should appreciate that competition and its associated market forces have led to the use of fewer resources, even as America is producing more things than ever.
But still, many people support significantly limiting the energy Americans, and other around the world, could use. If such limits were imposed, who would be hurt, and who would be hurt most? That’s a question we’ll examine in the next essay.
Links to all essays in this series: Part 1; Part 2; Part 3; Part 4; Part 5; Part 6; Part 7; Part 8; Part 9.

