Skin in the Game – Part 3
Some consequences of the fertility bust.
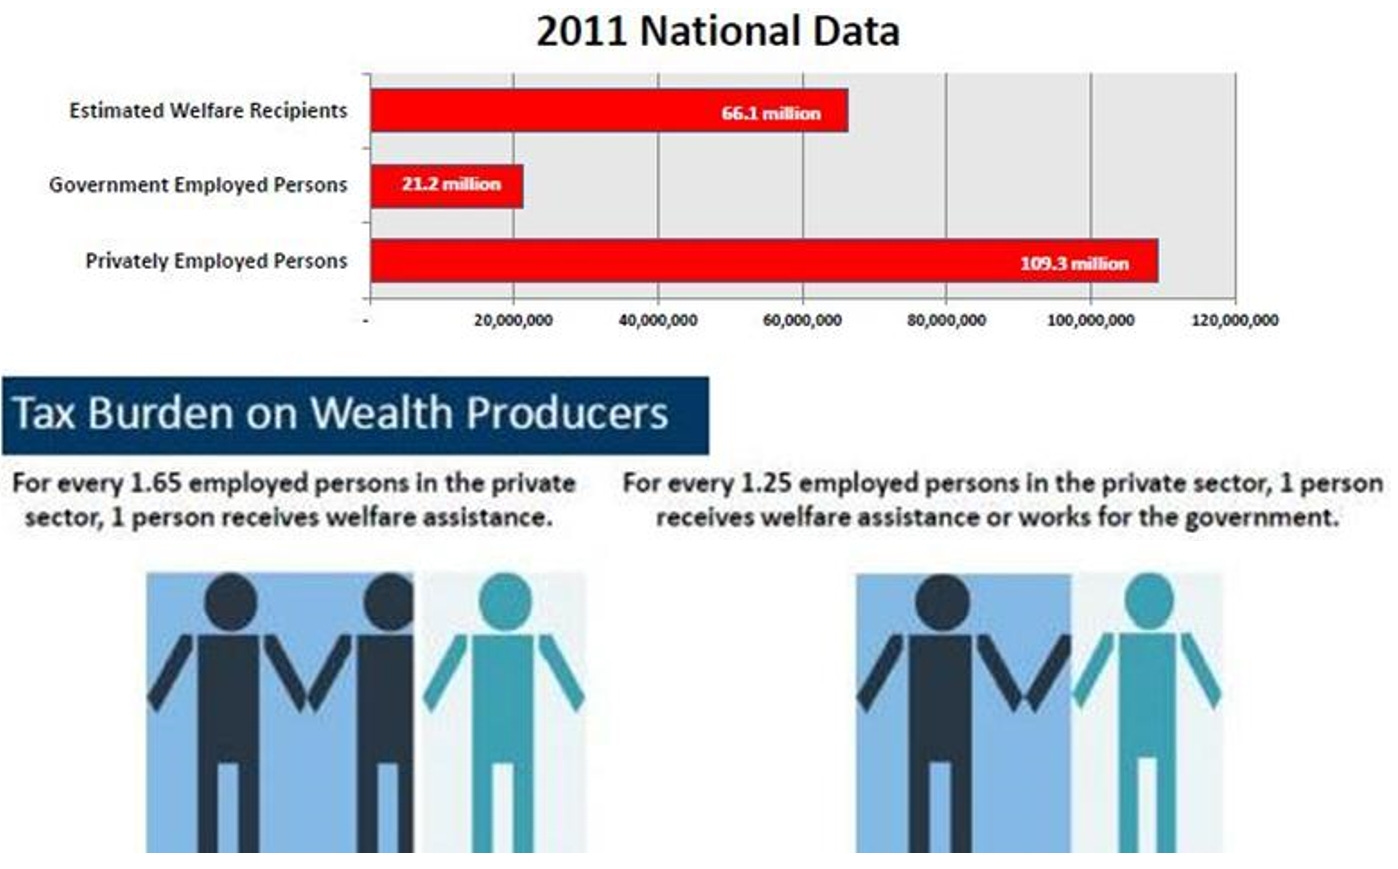
With fewer younger people working in the future, the tax burden will be even greater on the young tomorrow to pay the costs of large stimulus and entitlement funding today. And as more and more younger workers are dropping out of the labor force, fewer workers today are paying for more of everyone’s government benefits. Former Pennsylvania Secretary of Public Welfare Gary Alexander put the following charts together several years ago to illustrate the problem.
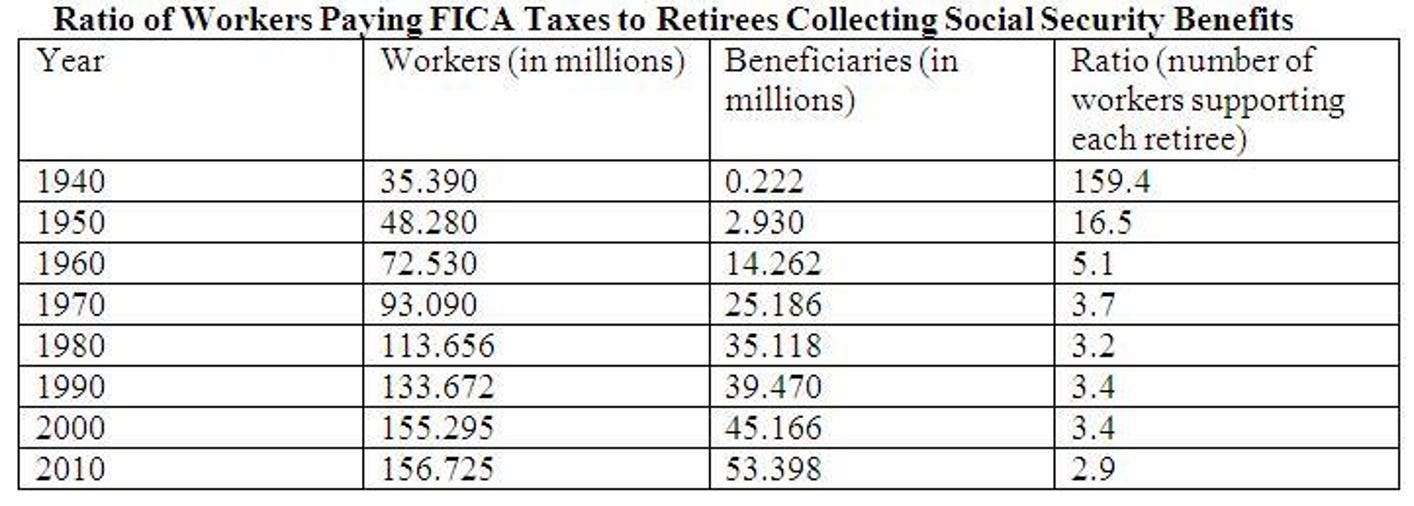
Fewer births means there will be even fewer workers to pay for growing government benefits programs in the future, including Social Security. The chart below (taken from Jonathan Last’s book What to Expect When No One’s Expecting) shows the declining ratio of workers paying FICA taxes (Federal Insurance Contributions Act taxes to fund Social Security and Medicare) to retirees collecting Social Security benefits.
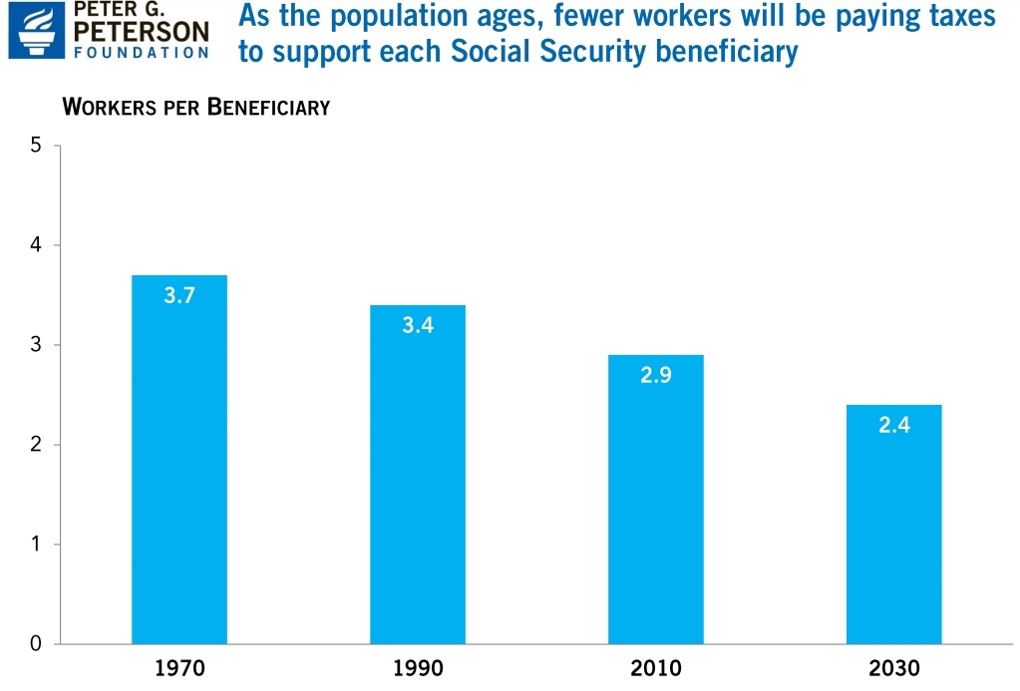
The current ratio of workers paying into these old-age programs to people tapping them is currently about 2.9 for every Social Security recipient.
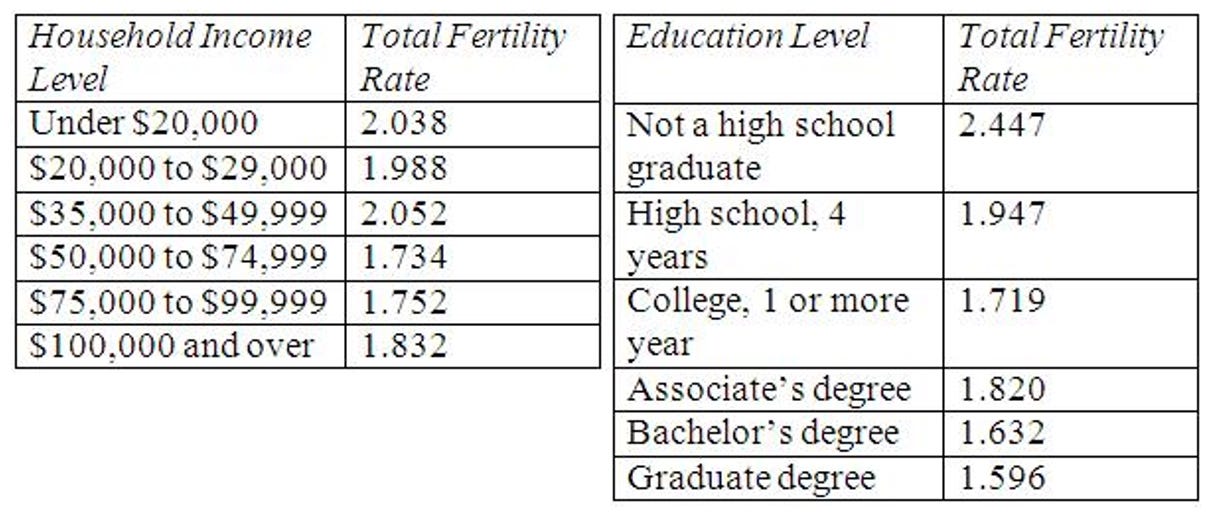
Birth rates are lowest among those with higher income and education levels.
The U.S. fertility collapse is on par with the Canadian collapse in the 1970’s, the Japanese collapse in the 1970’s, and the European Union collapse in the 1970’s or 1980’s, and none of these other countries has returned to replacement-rate fertility.
Because there will be significantly fewer productive taxpayers per entitlement program recipient going forward, even a decade ago the Internation Monetary Fund projected that under something like current policies, the next generation will have to see their taxes raised by over 20 percent in order to pay for the benefits scheduled for the current generations.
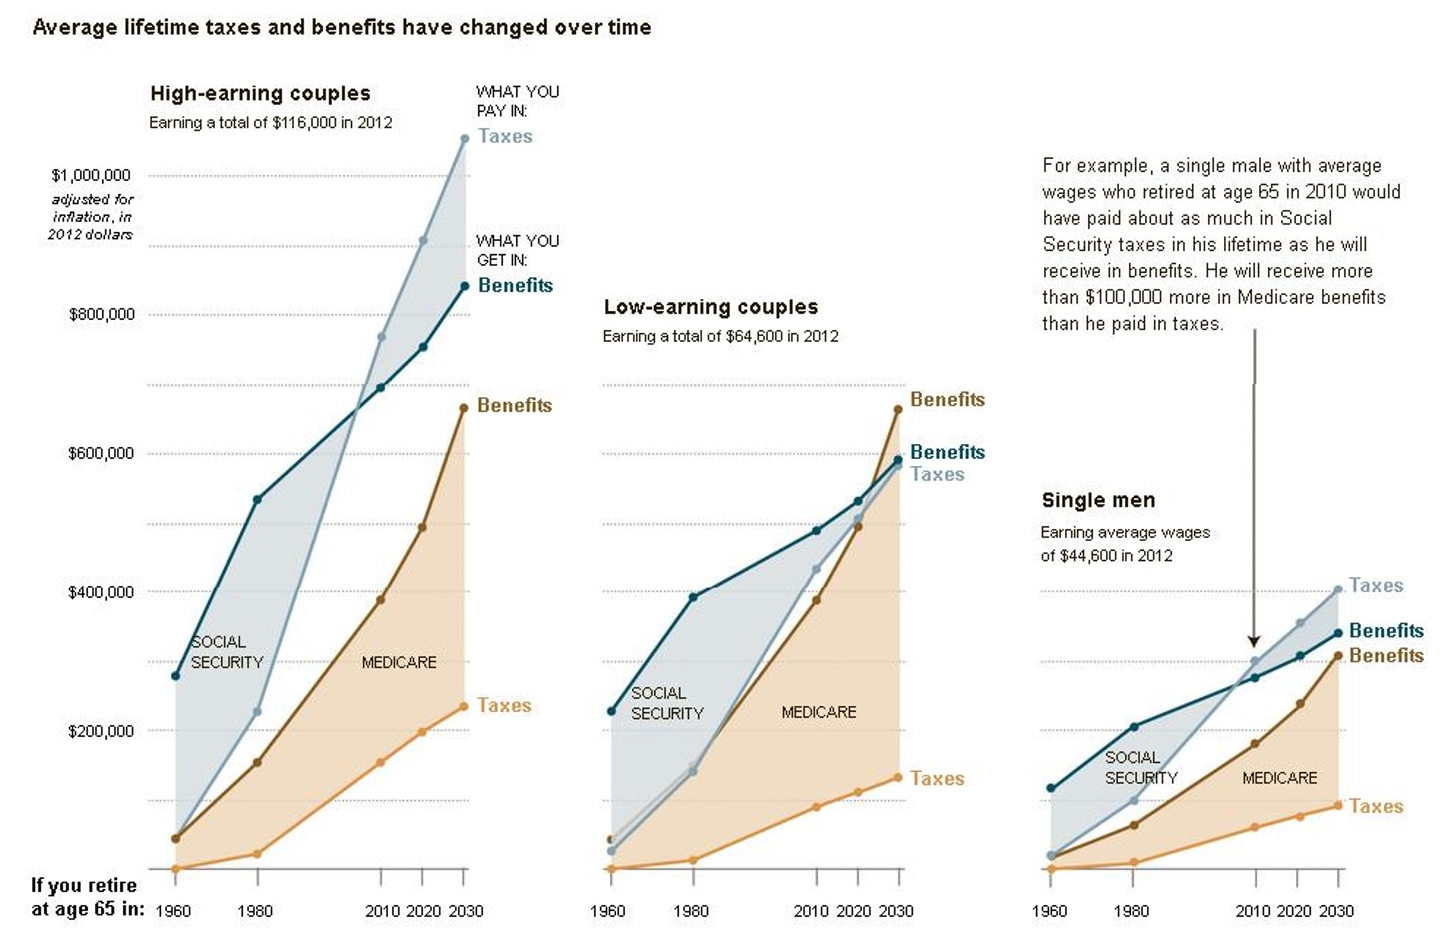
Current older generations receive more in public benefits than they pay in taxes, and so future generations will have to pay much more in taxes to cover public benefits costs to themselves and to cover those costs incurred by all the older generations as well (see the table below, in which numbers higher than 100 indicate a person will receive more in benefits than they pay in taxes). As the younger must pay more to support the older, the younger are less able to afford children of their own, and so they may have fewer children, and the situation will worsen going forward.
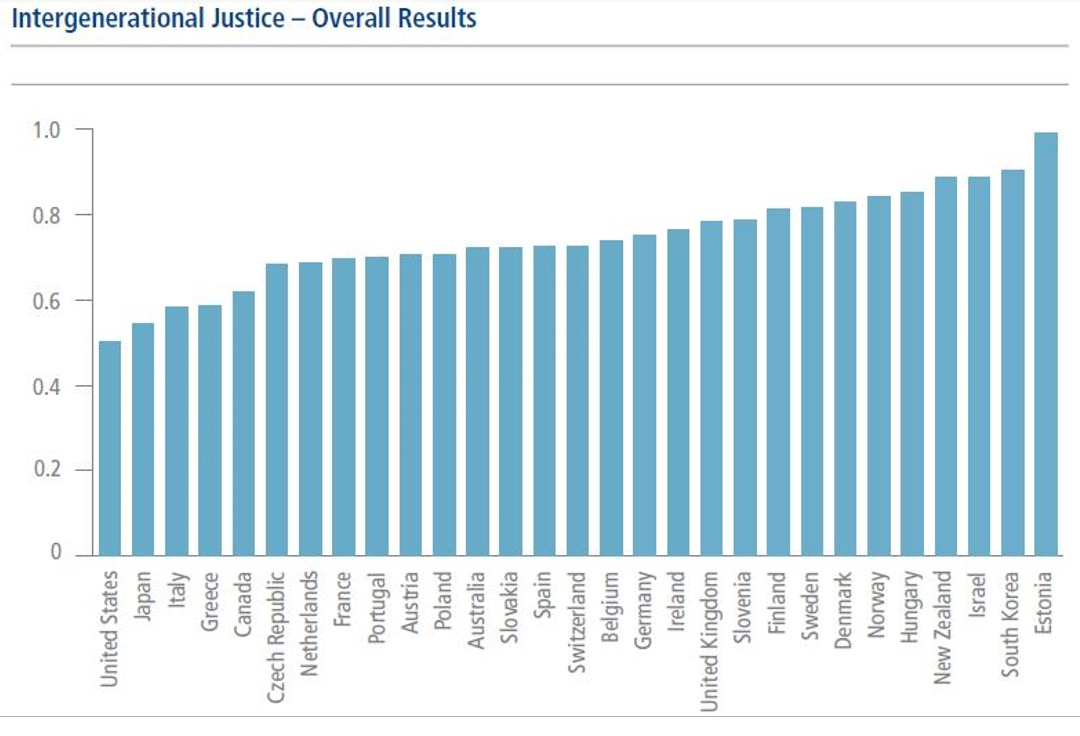
A 2013 cross-national study found that the United States ranked worst among 29 advanced countries in the degree to which it imposes unfair burdens on future generations. The study examined measures such as public debt per child, the ratio of childhood to elderly poverty, and the skew toward the elderly in social spending.
And as was mentioned in a previous essay, if one looks at federal revenues past and projected under current law, and then calculates how much is left after paying Social Security, Medicare, and other benefits promised under law and interest on the federal debt (that is, how much is left for things like scientific and medical research, education, infrastructure, and defense), one sees that over time what is left is less and less, such that while in 1974, 50 percent of federal revenues remained for purposes other than entitlement spending, but in 2014 only 16 percent remained.
Medicare beneficiaries on average pay about $1 in taxes for every $3 in benefits received, and the gap is projected to grow. Social Security beneficiaries who retired 20 to 40 years ago received more in benefits than they paid in taxes, but for those retiring in 2010, the amount was about even. Younger generations are expected to pay more in Social Security taxes than they receive in lifetime benefits, based on average life expectancies.
The wealth gap between older and younger adults has also grown significantly over the last few decades, such that in 1984, older adults had 13 times as much wealth as young adults. By 2009, they had 44 times as much wealth.
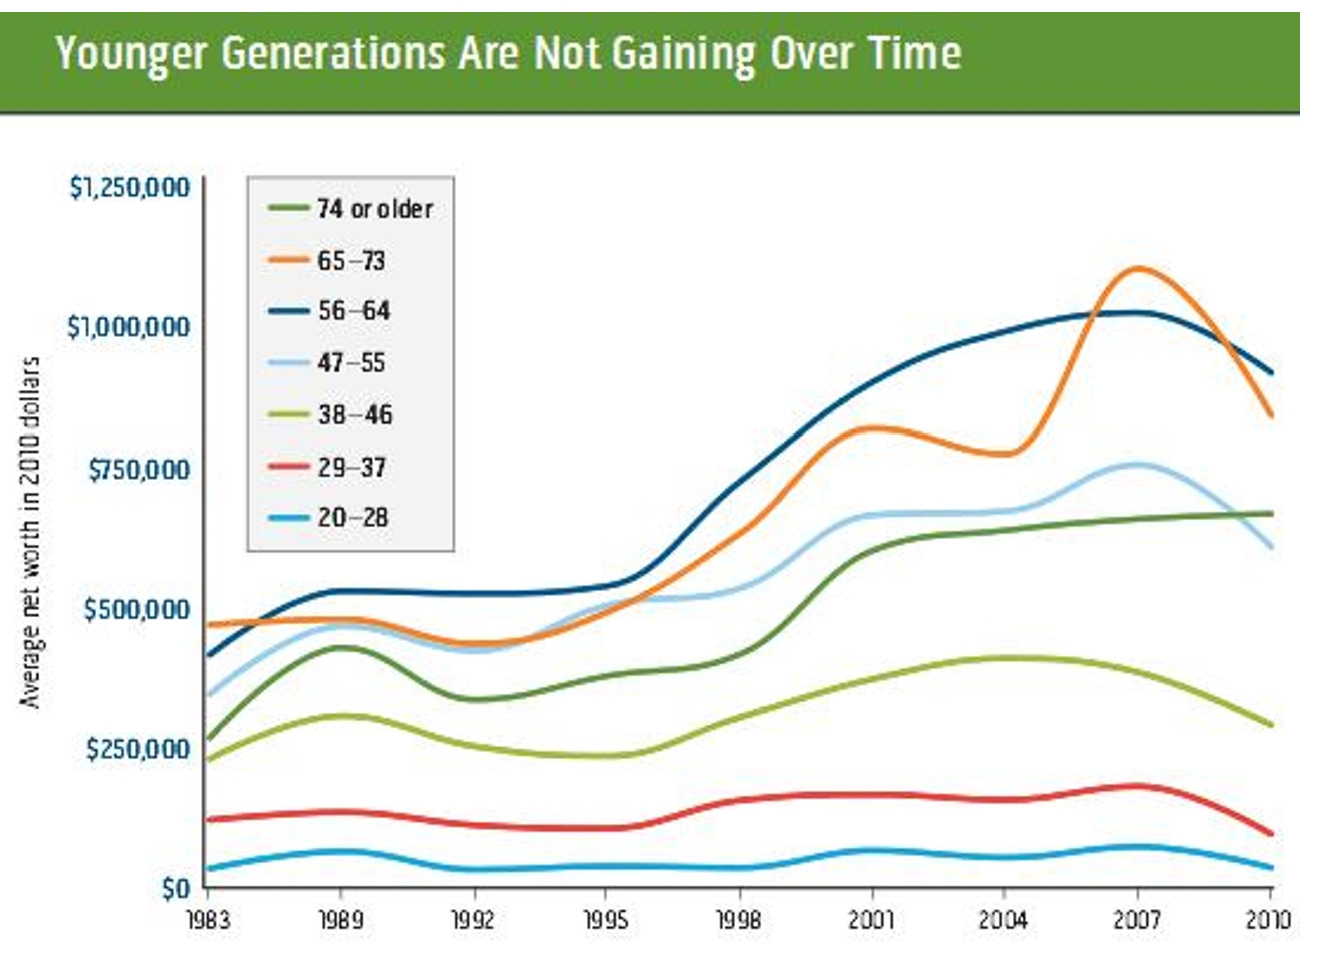
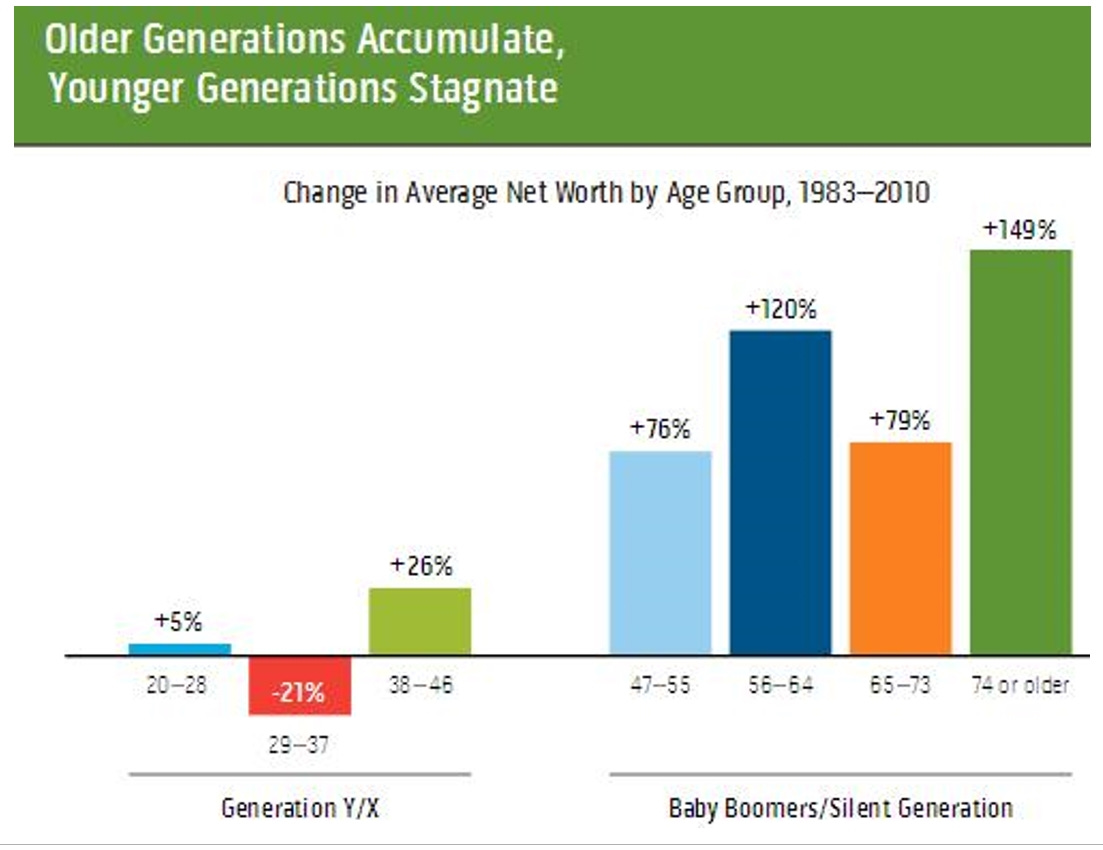
Already, the younger generations are accumulating less wealth than their parents did at the same age, meaning they will be less able to support themselves with their own resources throughout life and when they retire. As America’s debt burden looms, the younger generation will be facing much higher tax bills, both in total and as a share of their incomes, than their parents, unless the system is reformed.
In the chart below, the comparison is between people of the same age in 1983 and 2010. As researchers at the Urban Institute concluded: “If current trends for younger generations are not reversed, within a few decades they may become more dependent than older Americans today, especially in retirement, upon safety net programs less capable of providing basic support. As we grapple with broad issues of budget, tax, and educational reform, we need to be sure that such efforts include a focus now, not at some future point, on asset building for generations X and Y and successor generations.”
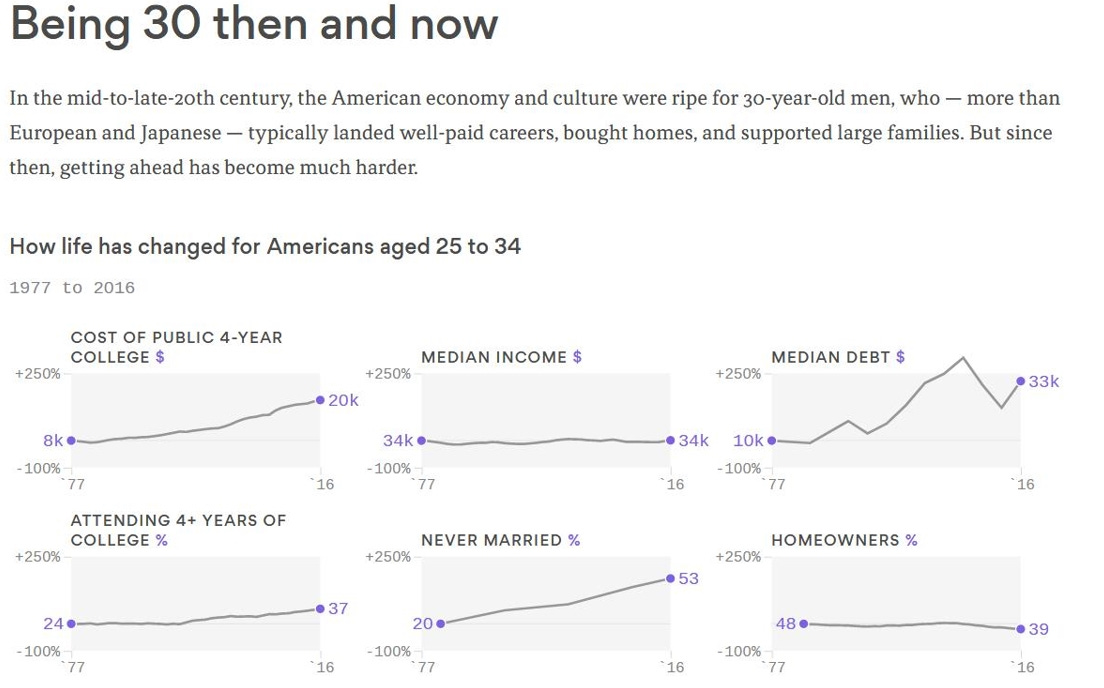
The following chart shows some of the differences between being 30 years old in 1977 compared to being 30 years old in 2016.
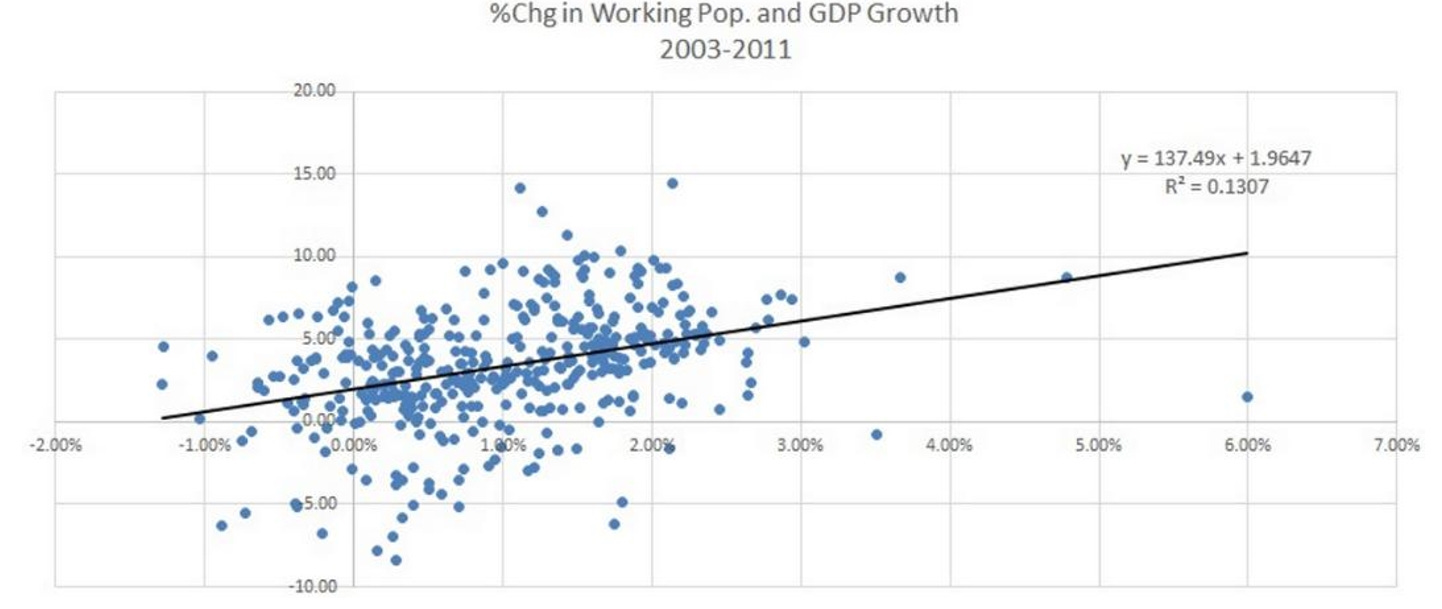
Overall, there’s a positive correlation between growth in the working age population and growth in the economy (in the chart below, each dot represents a country). Accordingly, one could expect reduced economic growth will follow from reductions in the working age population.
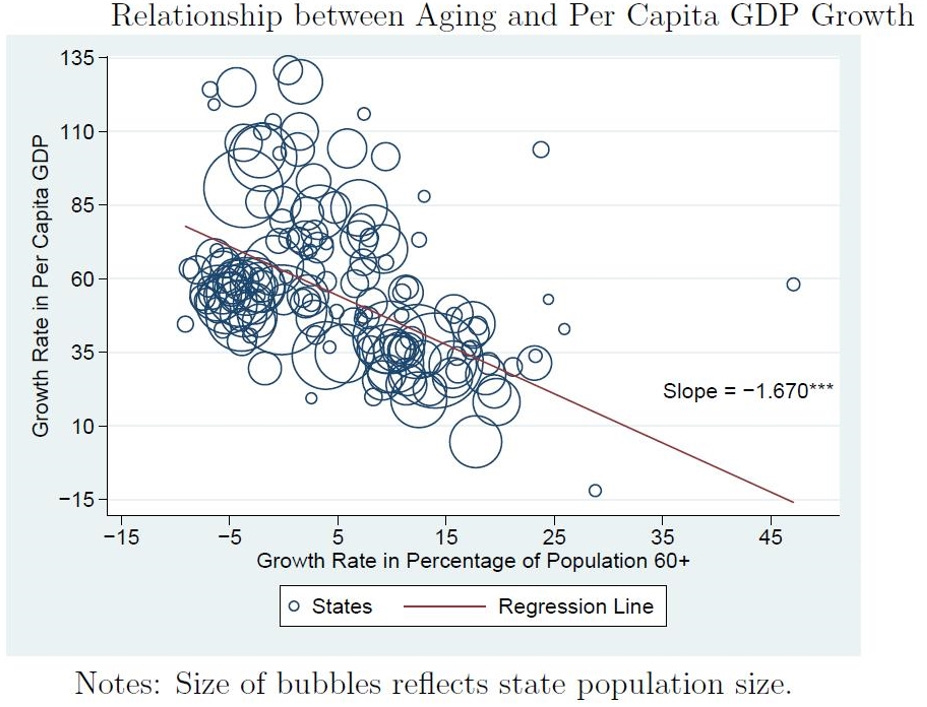
Researchers at Harvard and the RAND Corporation have concluded that, in the United States, “a 10% increase in the fraction of the population ages 60+ decreases the growth rate of GDP per capita by 5.5%. Two-thirds of the reduction is due to slower growth in the labor productivity of workers across the age distribution, while one-third arises from slower labor force growth. Our results imply annual GDP growth will slow by 1.2 percentage points this decade and 0.6 percentage points next decade due to population aging.”
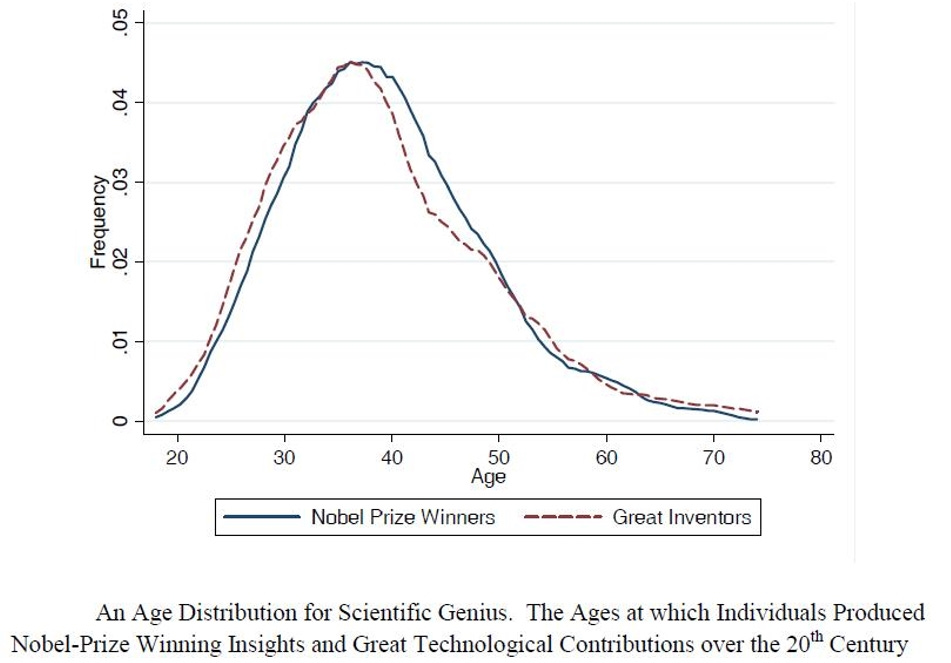
As economist Gary Becker has pointed out, low fertility rates also reduce the rate of future innovations, as people have tended to produce the most innovations in their mid-30’s, not later in life.
As Robin Hanson writes:
Here is why innovation grinds to a halt with a falling population. Assume total innovation so far is proportional to an integral over all past econ activity. In an exponentially rising economy, econ activity in the last period is a substantial fraction of all econ activity so far. But in an exponentially falling economy econ activity in the last period becomes a much smaller fraction of all econ activity so far, a fraction that falls to zero as the size of the economy fall to zero.
As Tyler Cowen asks, “The National Institutes of Health (the largest science-funding body in the U.S.) reports that, in 1980, it gave 12 times more funding to early-career scientists (under 40) than it did to later-career scientists (over 50). Today, that has flipped: Five times more money now goes to scientists of age 50 or older. Is this skew toward funding older scientists an improvement? If not, how should science funding be allocated?”
Whether it’s an improvement or not, it may simply be a function of a society in which, proportionately, older people come to increasingly outnumber younger people.
Links to all essays in this series: Part 1; Part 2; Part 3; Part 4; Part 5

