Skin in the Game – Part 4
The politics of “no DNA in the game.”
In essays posted before the holiday hiatus, I described how people with children might have an extra incentive to support policies that will improve the well-being of the next generation because people with children have “skin in the game” -- in the form of the DNA they’ve passed on to their kids. Now let’s look at the political ramifications of that extra incentive, including some of the trends associated with how parents actually vote and what policies they tend to support.
As Joel Kotkin and Ali Modarres have reported, the preference for rural areas by those raising children mean that fewer children today are living in cities. They write, “In cities with populations greater than 500,000, the population of children aged 14 and younger actually declined between 2000 and 2010, according to U.S. Census data ... The 14-and-younger population increased in only about one-third of all census-designated places, with the greatest rate of growth occurring in smaller urban areas with fewer than 250,000 residents.” And as Derek Thompson reports in The Atlantic:
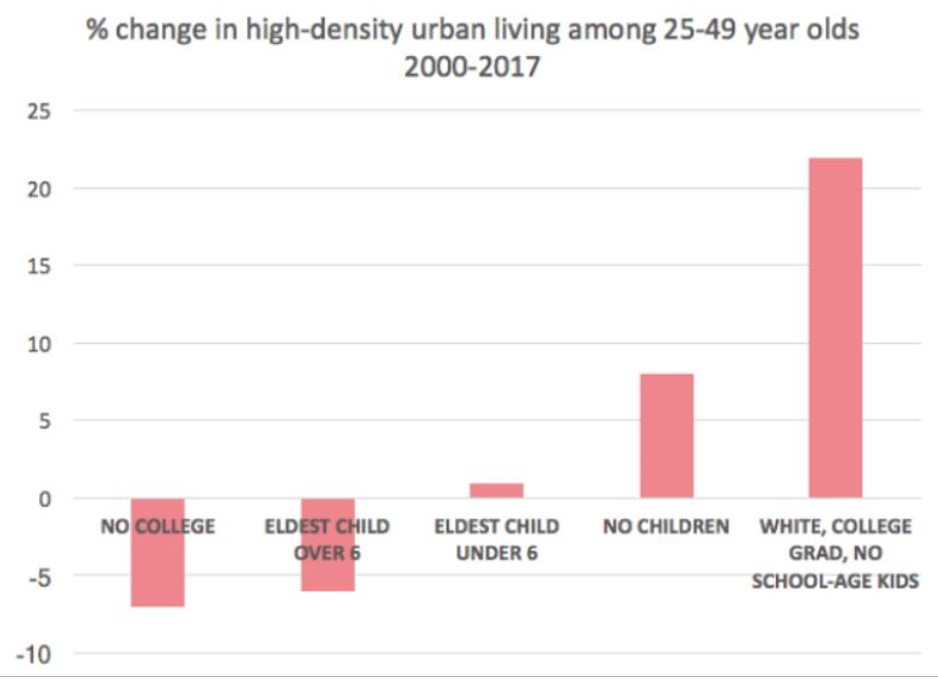
In high-density cities like San Francisco, Seattle, and Washington, D.C., no group is growing faster than rich college-educated whites without children, according to Census analysis by the economist Jed Kolko. By contrast, families with children older than 6 are in outright decline in these places. In the biggest picture, it turns out that America’s urban rebirth is missing a key element: births.
As Joel Kotkin has summarized:
The bluer the city, generally, the fewer the children. For example, the highest percentage of U.S. women over age 40 without children -- a remarkable 70 percent -- can be found in Washington, D.C. In Manhattan, singles make up half of all households. In some central neighborhoods of major metropolitan areas such as New York, San Francisco, and Seattle, less than 10 percent of the population is made up of children under 18. Perhaps the ultimate primary example of the new child-free city is San Francisco, home now to 80,000 more dogs than children, and where the percentage of children has dropped 40 percent since 1970 …
Researchers have found that adults who choose not to have children tend to have more liberal political views:
[C]hildfree individuals [people who choose not to have children] were more liberal than parents … The fact that we were unable to identify significant differences in personality traits between childfree individuals and parents suggests that the decision to be childfree is not driven by individual personality traits, but instead may be driven by other individual (e.g., political ideology) or situational (e.g., economic) factors. Indeed, we did find that childfree individuals were significantly more liberal than parents, even after controlling for demographic characteristics.
Political conservatives are more likely to be married than liberals, and many more Republicans than Democrats are married with children. The Pew Research Center has found that:
The growing “red-blue” divide in politics and government is also evident in attitudes and behaviors related to family. For starters, Republicans and Democrats tend to live in different types of families. Two-thirds of Republicans (67%) are married, and 57% are married with children. Among Democrats, only 45% are married (38% are married with children). Democrats (9%) are twice as likely as Republicans (4%) to be living with a partner without being married. Among independents, 52% are married and 48% are unmarried.
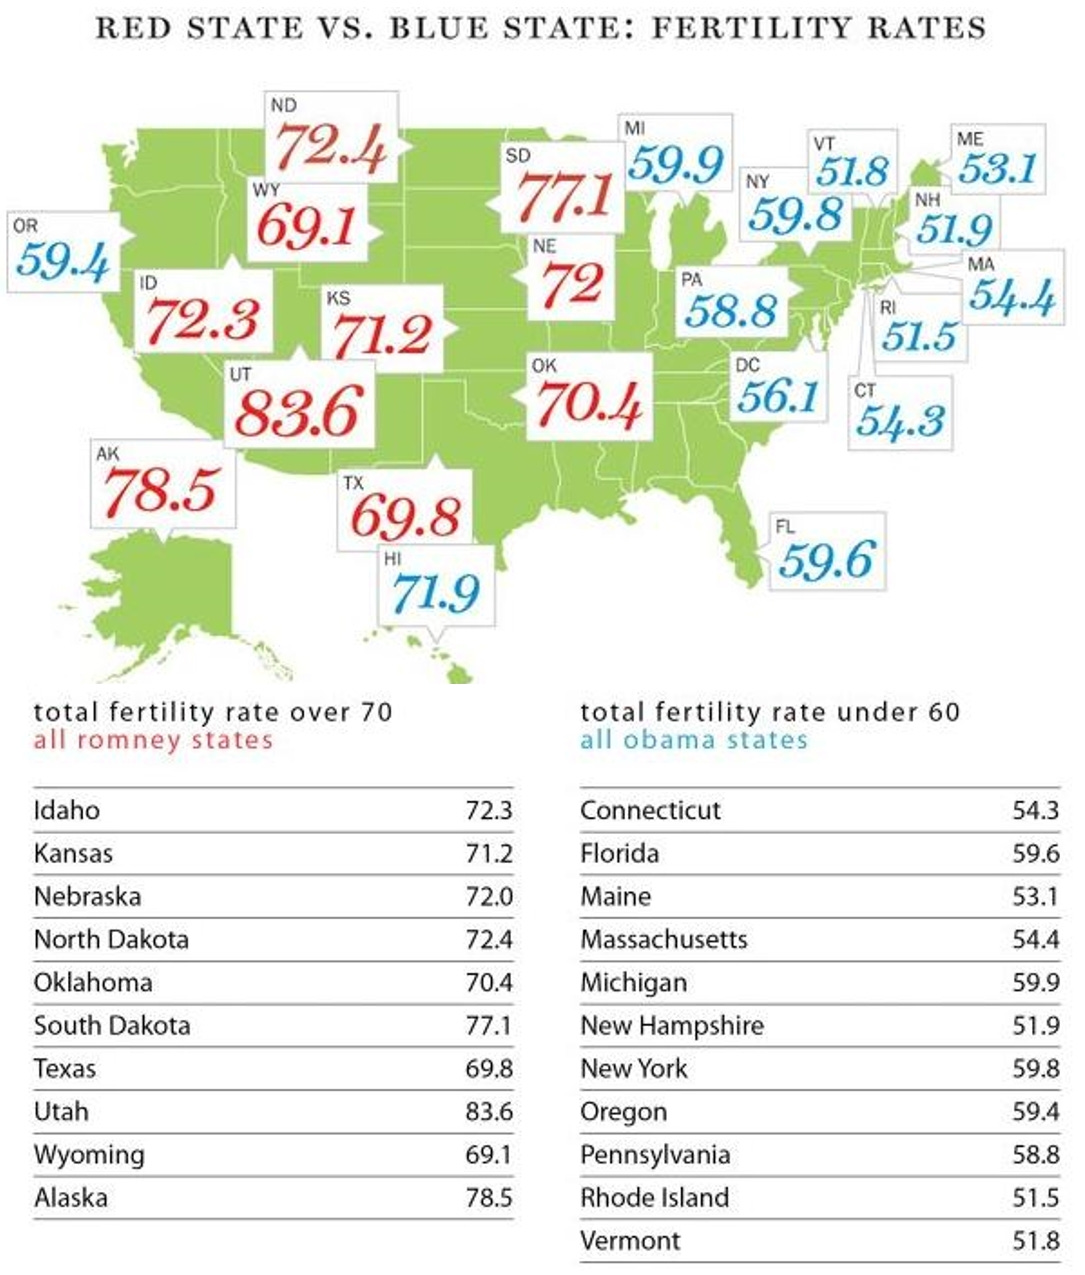
State fertility rates also tend to correlate with presidential election voting patterns, with lower fertility states tending to vote for Democratic Party (blue state) candidates. An exceptional state like California (with a relatively high fertility rate, but voting Democratic) has the largest foreign-born Hispanic population (27 percent), a population with a higher fertility rate.
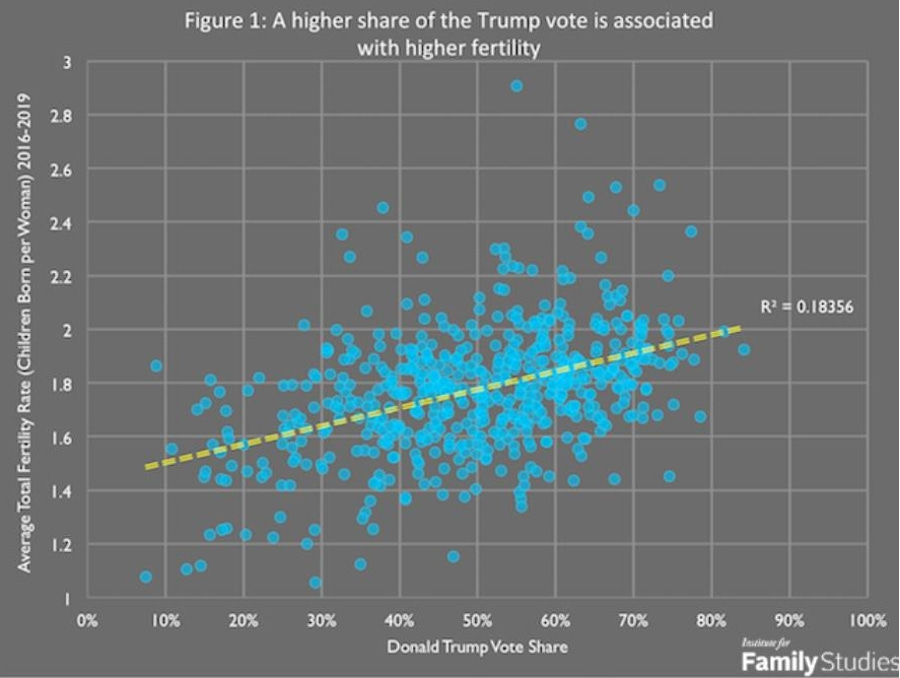
As Lyman Stone notes, in the 2020 presidential election, the fertility rate in various counties correlated with a preference for Trump or Biden. He writes:
In this [2020 presidential] election, the association between fertility rates and voting patterns was crystal clear. The figure below shows the share of a county’s vote won by President Trump vs. the total fertility rate for that county from 2016 to 2019, the latest available data.
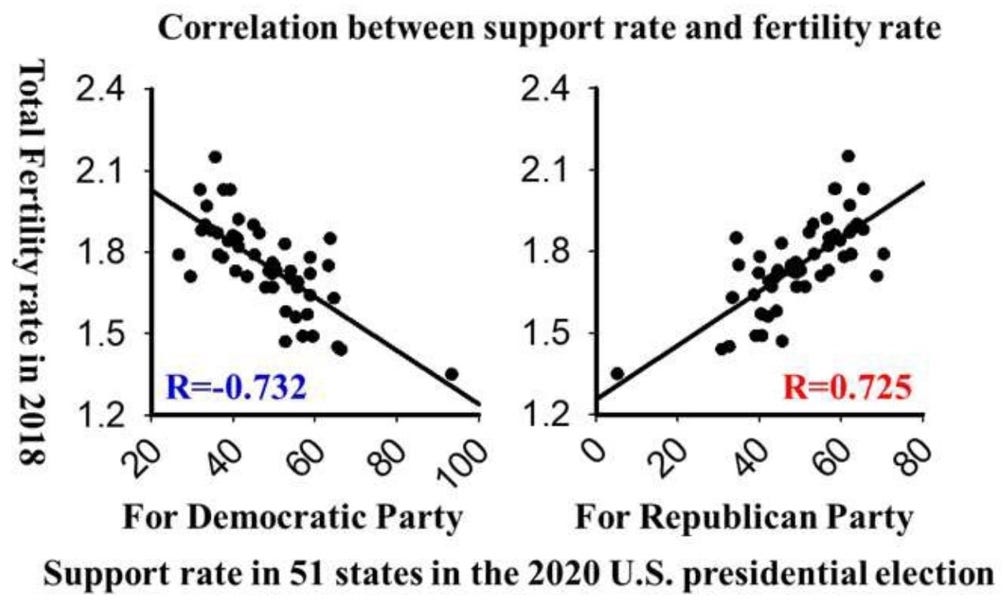
Data about fertility rates is only available for around 600 of the largest counties, thus many small, rural counties are excluded. But the relationship shown here is clear: President Trump did better in counties with higher birth rates, and the difference is fairly large, with the most pro-Biden counties having total fertility rates almost 25% lower than the most pro-Trump counties … Yi Fuxian at the University of Wisconsin showed that the relationship between voting and fertility is even more pronounced when we look at fertility rates and state voting trends.
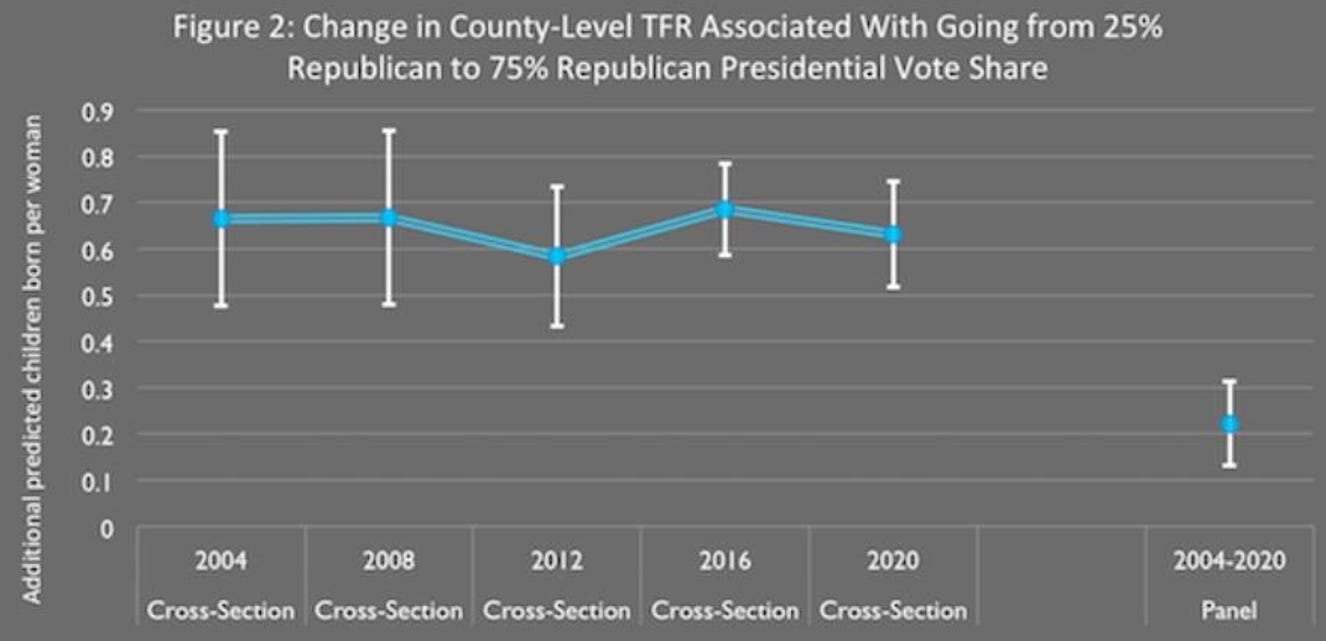
Nor is the relationship between fertility and presidential voting a spurious result related to urbanization, race, or state practices in drawing county lines. The figure below extends the analysis to more presidential elections, and includes controls for the state a county is in, the county’s non-Hispanic white population share, and the county’s population density.
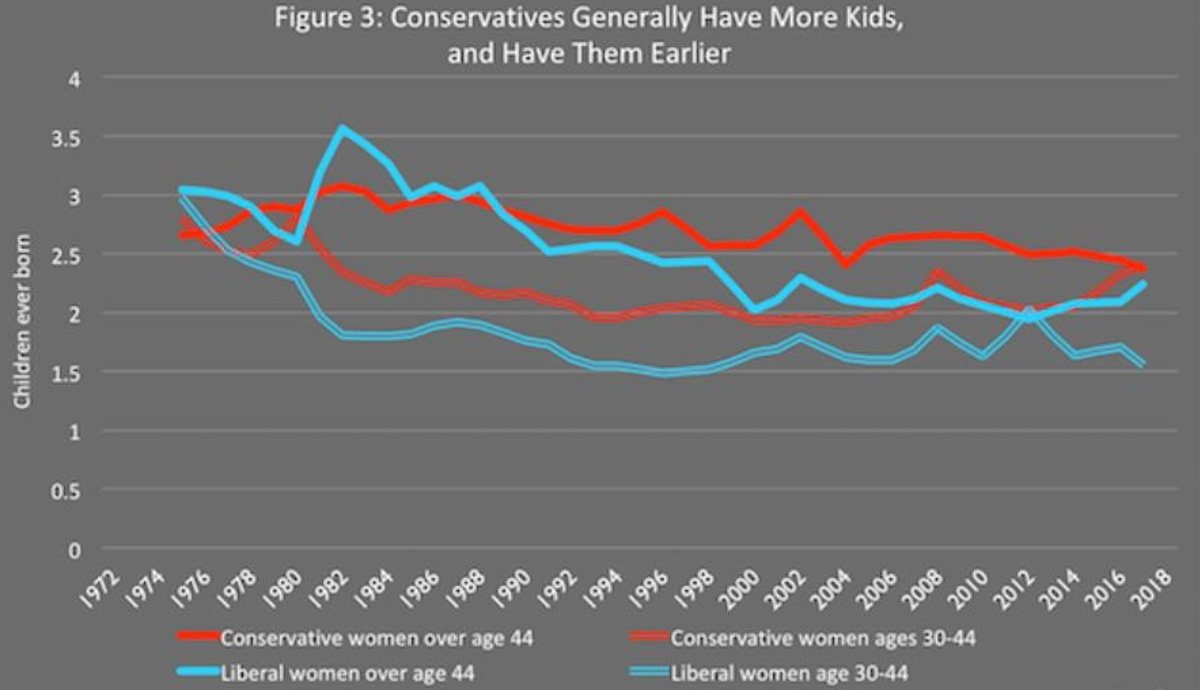
As can be seen, the Republican fertility advantage is relatively stable across elections. It even shows up in a panel model, suggesting that as counties become more Republican, their fertility rates tend to rise relative to the national average … [D]ata from the General Social Survey can be used to provide a more granular understanding of the ideological fertility difference. The figure below shows the number of children ever born to women sampled in the GSS who were over age 44, and women ages 30-44, by political ideology …
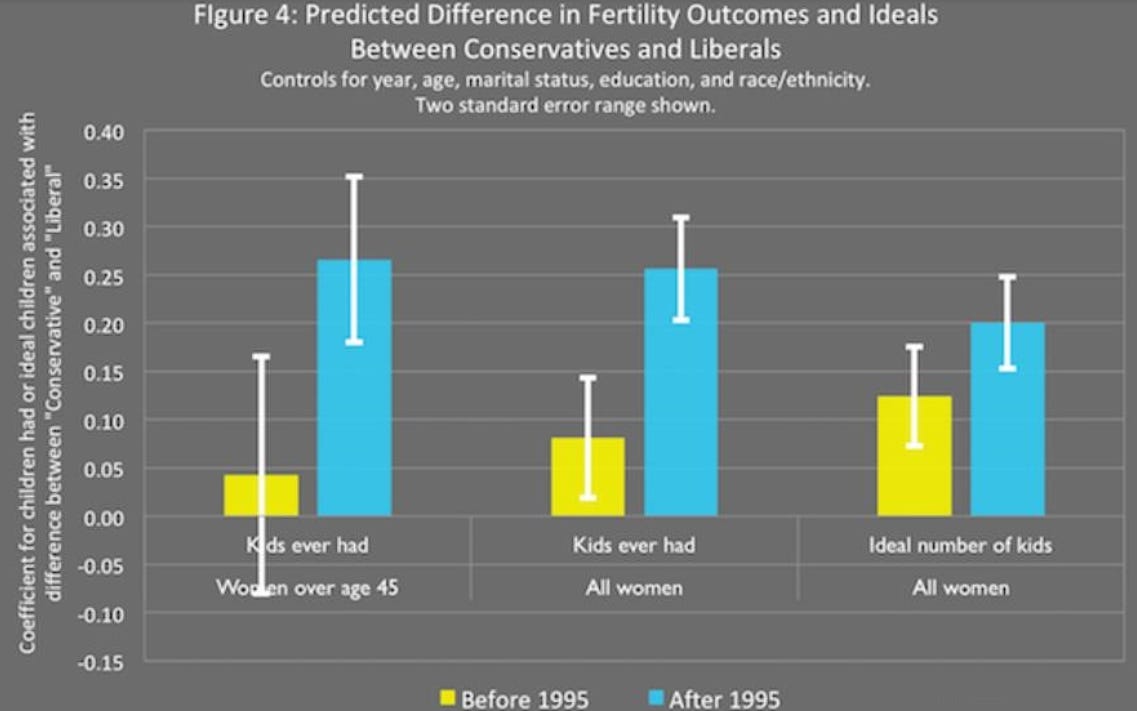
In recent years, the gap in childbearing between young conservative and liberal women has really opened, which may portend a bigger gap in the coming years. This graph has no controls for other factors. But the figure below introduces control variables for women’s age, the year of the survey, women’s race or ethnicity, educational level, and marital status. It shows the difference between conservative and liberal women after all these variables are controlled for, with the period 1972-1994 lumped together as one group, and 1995-2018 lumped together as another group …
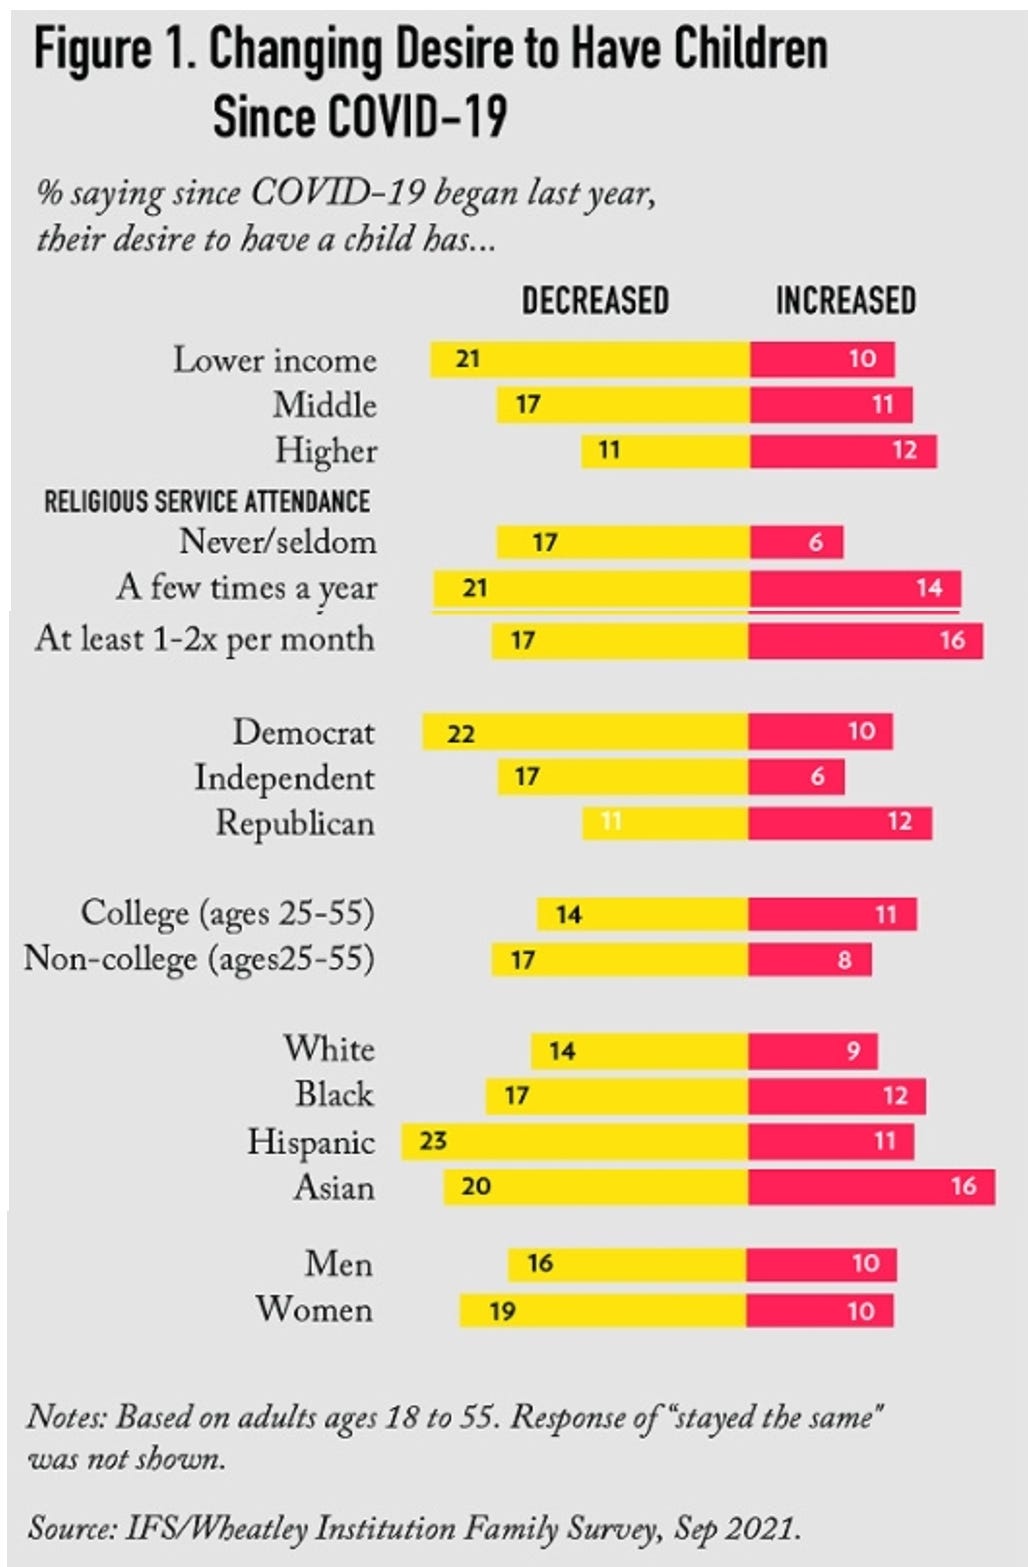
And as Timothy Carney reports, the COVID-19 pandemic doesn’t appear to have slowed this dynamic down:
Throughout the pandemic, fewer people in America reported a desire to have children. That change, however, is almost entirely among Democrats, according to a study by the American Enterprise Institute, the Institute for Family Studies, and Brigham Young University’s Wheatley Institute. Republicans were actually more likely to want babies post-pandemic, while desire among Democrats for children fell by a net of 12 percentage points.
In sum, there’s good evidence that having “DNA in the game” correlates with a greater concern with national fiscal responsibility and limited government, at least insofar as conservative views or Republican party affiliation indicates a greater concern with those issues.
Addendum: Pets Don’t Pay Off the National Debt
While Americans aren’t having as many babies as they used to, they’re getting more pets. Pet ownership and pet industry expenditures, are on the rise. (Of course, pets won’t have to pay off any federal debt, so owning them won’t count as having skin in the game in that regard.)
As was reported in 2016:
Young Americans are less likely to be homeowners, car owners or parents than their predecessors, but they do lead in one category: Pets. Three-fourths of Americans in their 30s have dogs, while 51 percent have cats, according to a survey released by research firm Mintel. That compares to 50 percent of the overall population with dogs, and 35 percent with cats. The findings come at a time when millennials, roughly defined as the generation born between 1980 and 2000, are half as likely to be married or living with a partner than they were 50 years ago. They are also delaying parenthood and demanding flexible work arrangements -- all of which, researchers say, has translated to higher rates of pet ownership.
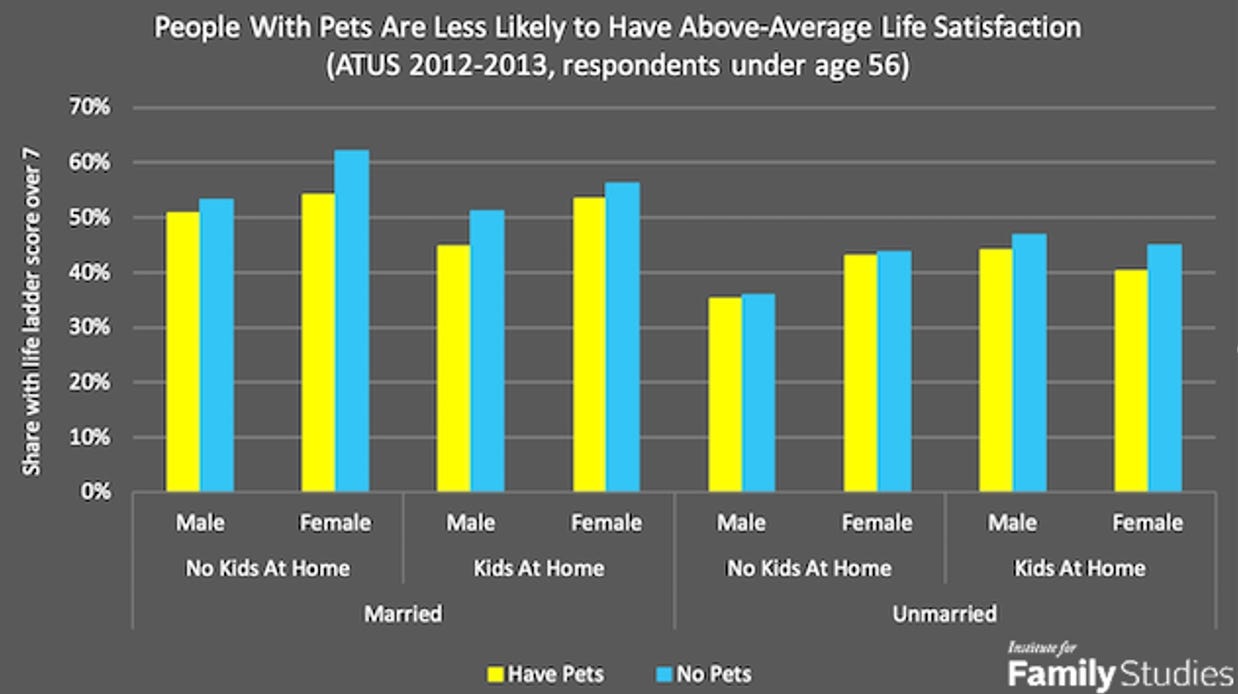
Surveys have found that people with pets, however, have lower general life-satisfaction than those without pets, and that decrease in happiness associated with having a pet is about the same size as the increase in happiness associated with a married couple having a child:
In 2011 and 2012, ATUS [American Time Use Survey] added a “well-being module,” which asked respondents a question about how happy they were with their life using a “life ladder” approach; basically, they rated their happiness or satisfaction with life on a scale of 0 to 10. The average respondent gave a score of about 7.1, so I look at the odds that a person gave a score of 8 or higher, indicating a high level of happiness. Figure 3 below shows the average life satisfaction rating by sex and broad demographic category, directly comparing those who did or did not report spending time with pets.
As the figure above shows, for every group, spending any time with pets is associated with lower life satisfaction. The change in odds that a person is very satisfied with their life that is associated with having a pet is highest for married women without children: married women without children who have a pet are much less likely to have high life satisfaction than those without a pet. In formal multivariable models with broad controls for things like family structure, age, employment status, coresidence with elders, disability, education, etc., the significant negative effect of spending any time on pets on happiness persists. People who spend time on household pets are simply less happy than demographically similar people who do not spend time on household pets. These effects aren’t just statistically significant: they’re quite large. Spending any time with pets is associated with a happiness decline about one-third as large as living with your parents, and about one-fifth as large as being disabled or unemployed. Having a pet reduces happiness by about half as much as being married increases it. These effects are even larger for the subset of people who spend more than an hour on pet care in a given day. While the happiness effects of children are hotly debated, I find that the decrease in happiness associated with having a pet is about the same size as the increase in happiness associated with a married couple having a child.
Links to all essays in this series: Part 1; Part 2; Part 3; Part 4; Part 5

