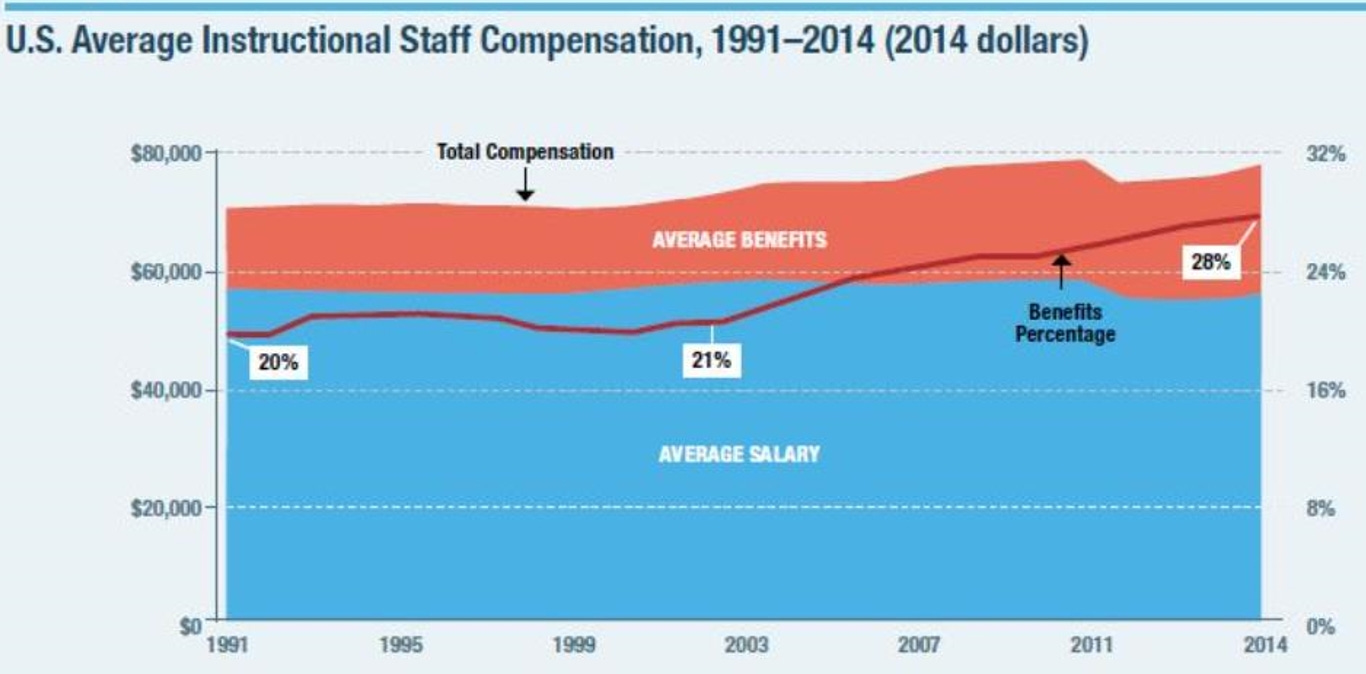
Regarding teacher pay, as Andrew Biggs and Jason Richwine have written, the chart below shows the Bureau of Labor Statistics (BLS) grades of a variety of occupations graphed against the median annual wage paid in those occupations, and teachers (the black dots on the chart) receive a salary premium of 9% compared to other occupations once their shorter work year is accounted for.
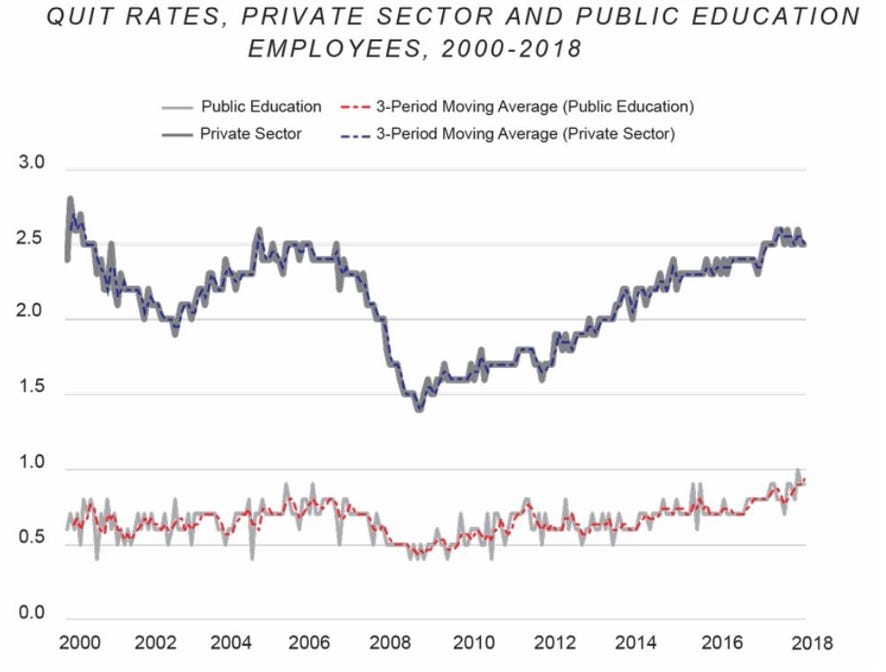
As Biggs and Richwine continue, “if teachers were underpaid, a large proportion might leave the profession because of low pay. But in fact, teachers quit their jobs at much lower rates than private-sector workers do.”
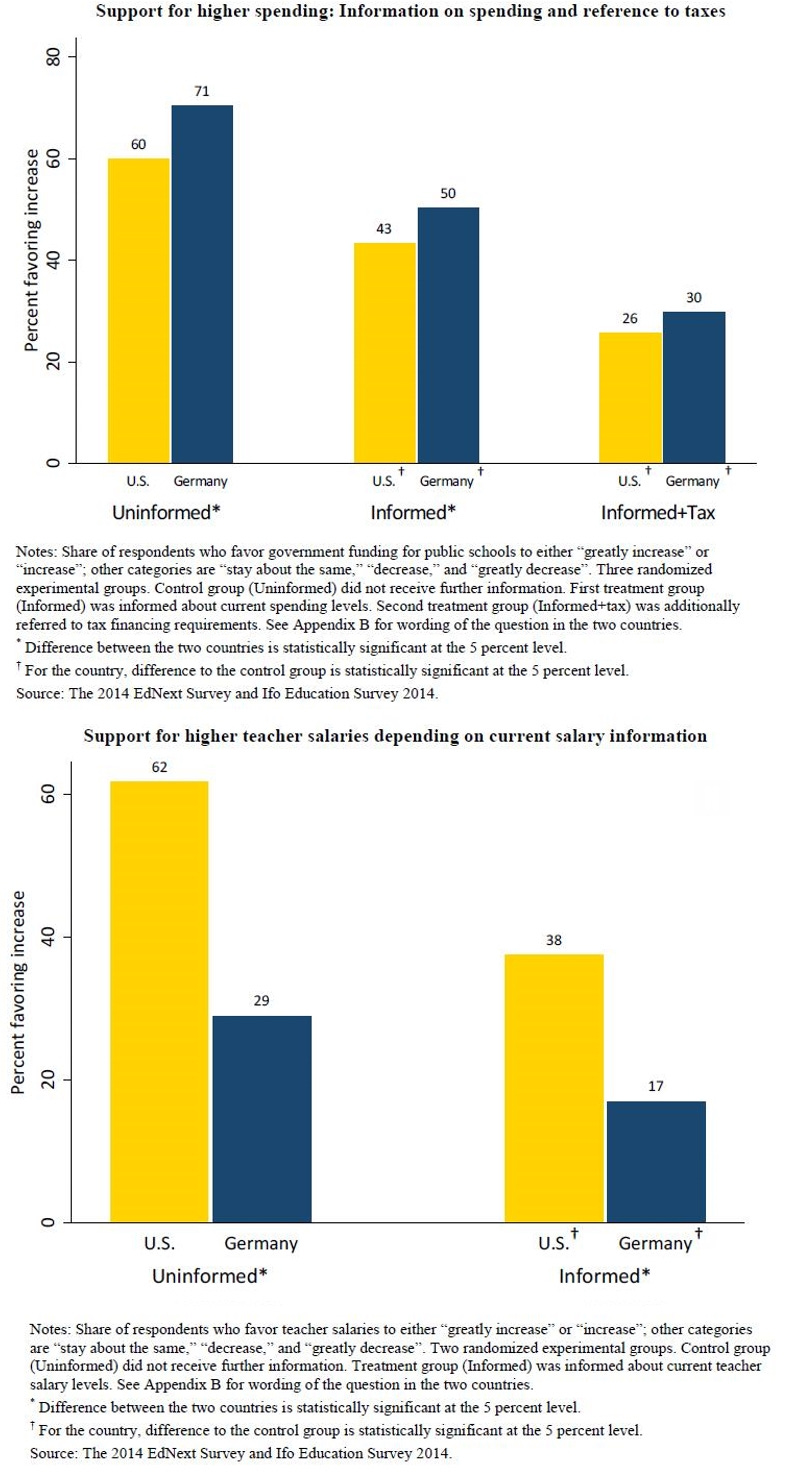
Researchers have also found that support for higher public education spending and higher public teacher salaries plummets after people are informed about current public education spending and tax financing requirements, and current public teacher salary levels.
Research also shows that teachers are generally disserved by the pension programs their unions negotiate for them. Researchers have found that:
Teacher pension systems are not only expensive; their structures are inequitable and misguided. Roughly 75% of teachers will be net losers from their pension plan because they will quit or change school districts before they have reached the minimum years of service to be eligible to receive a pension; or they will retire or leave the system before their contributions and the interest earned on them are more than the pension for which they then qualify. Even the winners in this pension lottery—the roughly 25% of teachers who remain on the job in the same system long enough to earn substantial retirement benefits—will have traded years of lower salaries in exchange for disproportionately large retirement benefits.
As much as government unions loathe Donald Trump, his Presidency has lifted their worker pensions. That’s one noteworthy finding from a new report by Fitch Ratings on state debt burdens … Fitch analyzed how states’ long-term liabilities as a share of their personal income has changed since 2016. This is a rough measure of a state’s fiscal sustainability, similar to a country’s debt-to-GDP ratio. Fitch also incorporated pension liabilities, which for many states are larger than direct debt they owe to creditors. First, the good news. State long-term liabilities as a share of personal income fell on average to 5% in fiscal year 2019 from 6% in fiscal year 2016. That’s a whopping 16% drop over three years. Improving ratios, Fitch notes, “have been driven by economic strength rather than by declining liabilities. Economic growth had been solid before the pandemic.” In other words, states aren’t going on an austerity diet. Personal incomes have been growing faster than liabilities. Median state personal incomes grew 4.1% annually between 2016 and 2019 on a compound basis. Yet median pension liabilities (adjusted for differences in discount rates) have risen 0.7% annually and direct debt has increased a mere 0.1% annually.
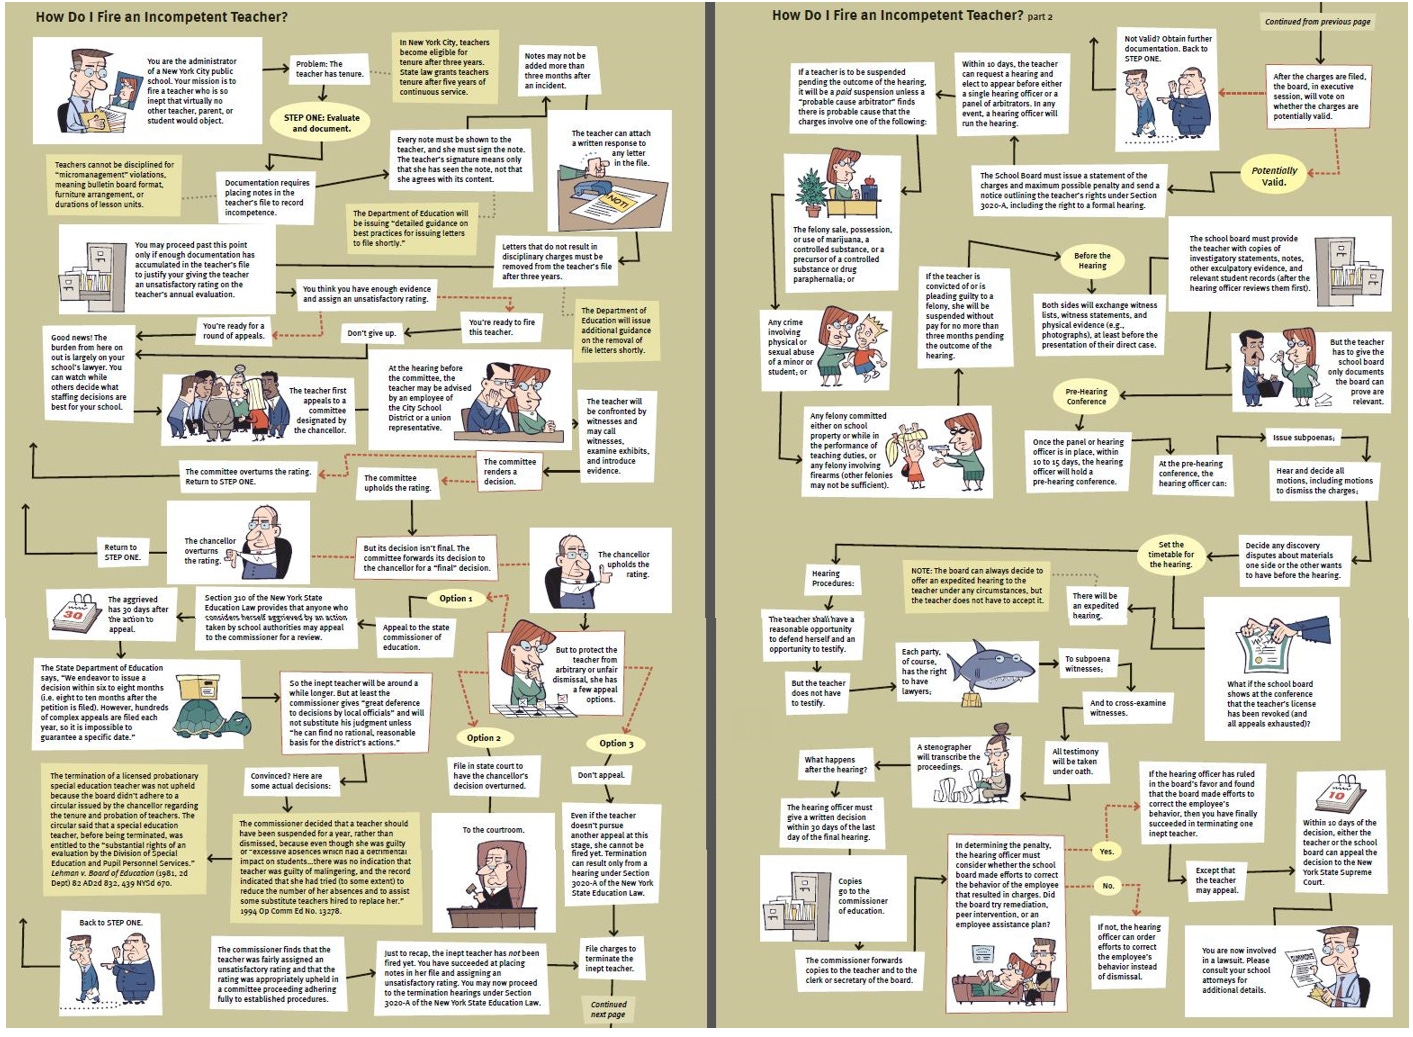
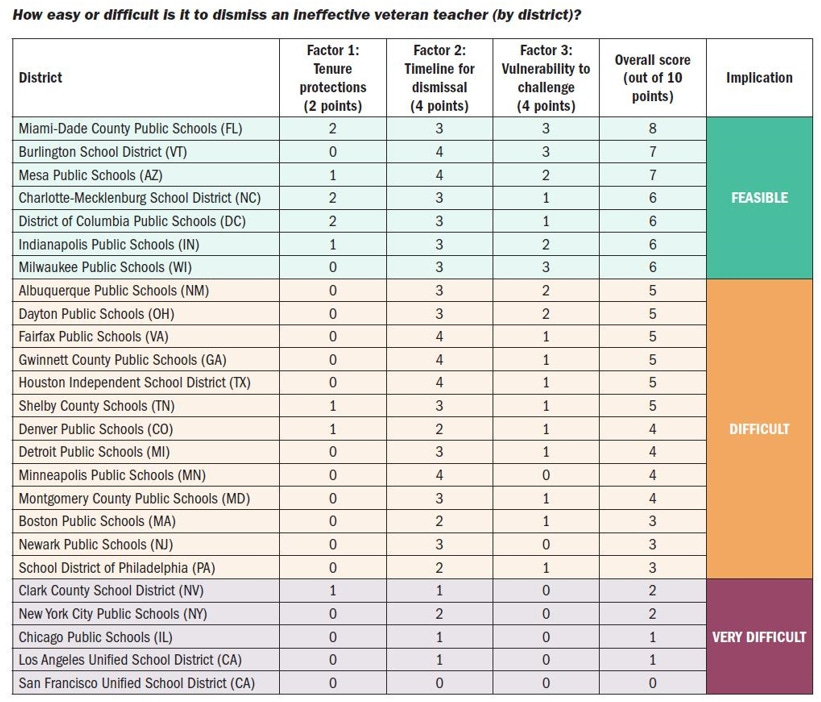
Of course, paying teachers more will not improve student performance unless bad teachers can be removed. Teacher retention rules negotiated by teachers’ unions make it very difficult to fire bad teachers. As an example, here is a chart showing the process required for removing a bad public school teacher in Chicago.
And below is a chart showing the same process required to remove a bad public school teacher in New York City.
A study by Fordham University shows that in most districts (and states), tenure continues to protect ineffective veteran teachers from performance-based dismissal.
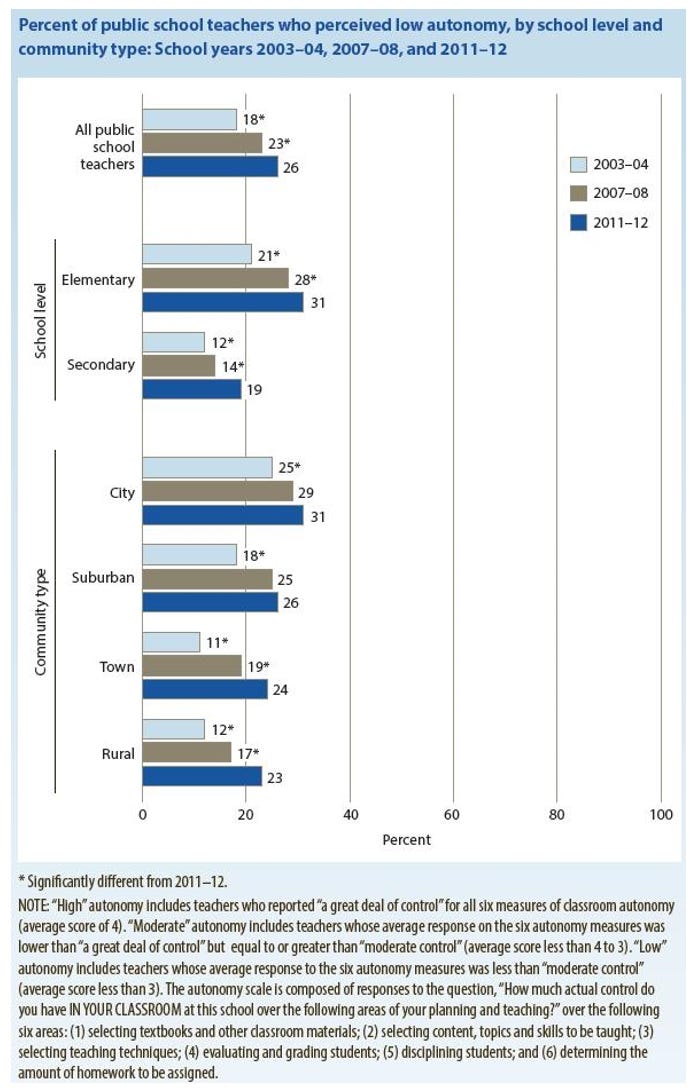
Research reported by the National Center for Education Statistics found that teachers themselves also report having increasingly less autonomy over how they run their own classrooms.
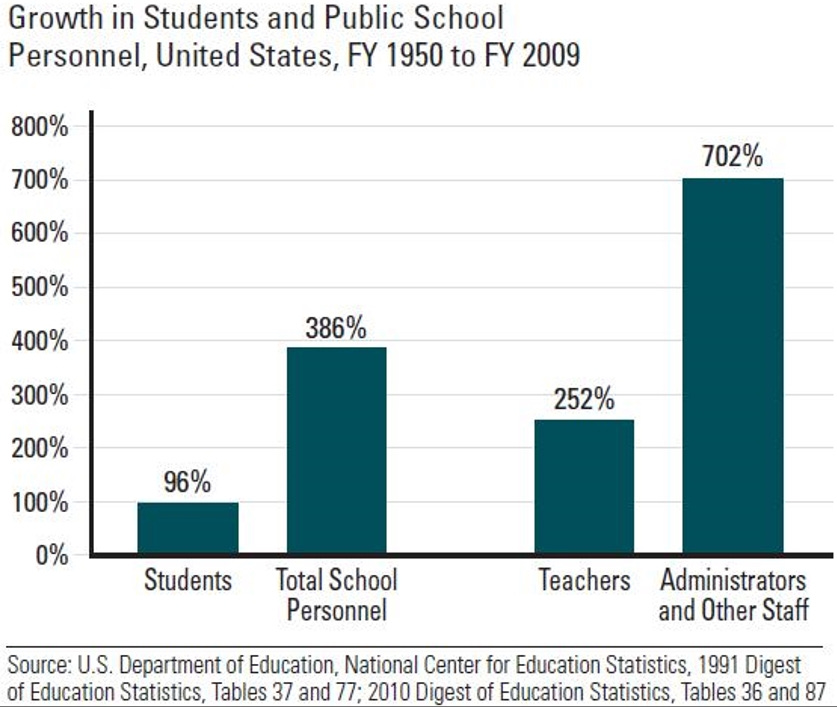
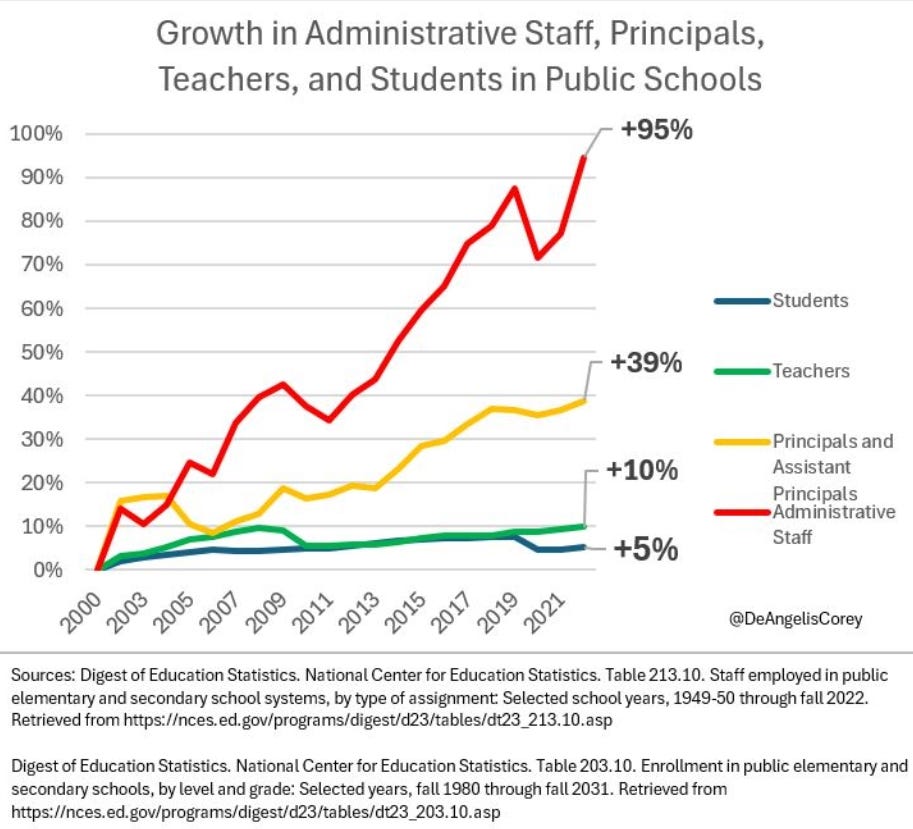
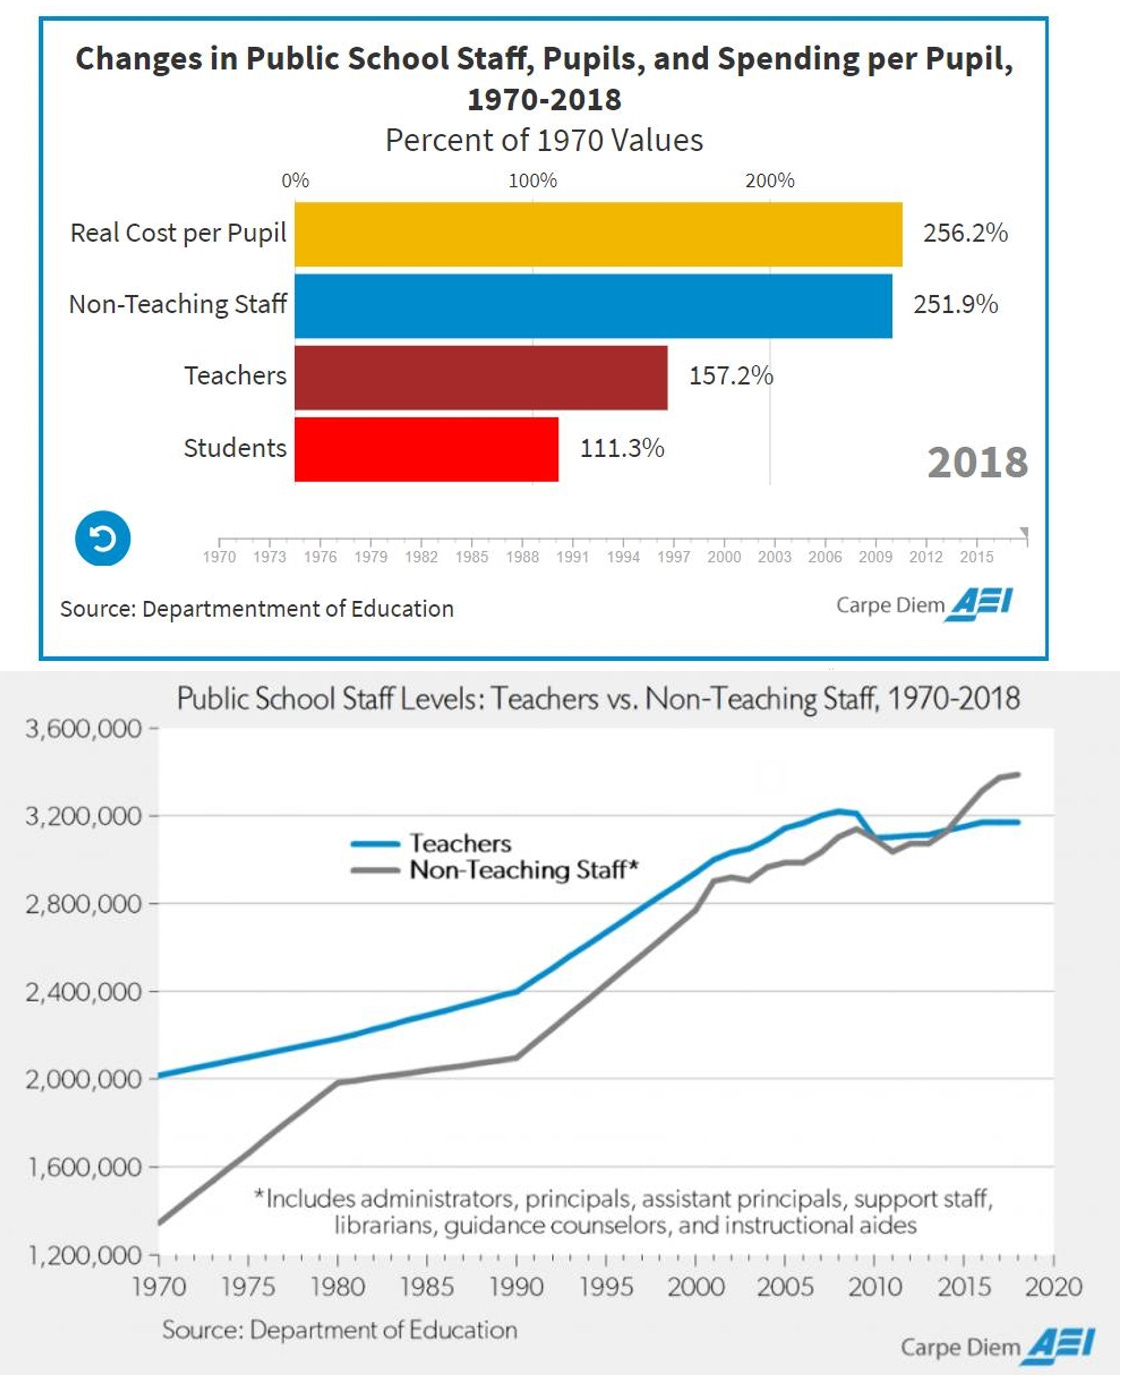
That’s due in part because, while the growth in teaching positions in America’s K-12 public education system has far outpaced the growth in the number of students, the growth in the number of administrators supervising the teachers has far outpaced the growth in the number of teachers.
[This chart] shows the growth over nearly the last 50 years in (a) the number of students enrolled in public schools (K-12), (b) the number of public school teachers, (c) the number of non-teaching public school staff (administrators, principals, assistant principals, support staff, librarians, guidance counselors, and instructional aides), and (d) the inflation-adjusted cost of public school education per pupil, all from 1970 to 2018. All of the figures shown in the animated chart are the percentages of 1970 values … In comparison to students, the number of public school teachers increased by 57.2% between 1970 and 2018 from about 2 million to 3.17 million, which reduced the pupil-to-teacher ratio by 30%, from almost 23-to-1 in 1970 to 16-to-1 in 2018. Over the same period, the number of non-teaching staff at public schools more than doubled, increasing by 152% from 1.34 million in 1970 to 3.38 million in 2018. Interestingly, while the number of public school teachers peaked in 2008 and has fallen slightly since then, the number of non-teaching staff has continued to grow and by 2015 there were more non-teaching staff than teachers for the first time and that gap has grown larger since then (see chart below). In 2018, there were 217,530 more non-teaching public school staff members (3.39 million) than teachers (3.17 million). As a direct result of public school staff (both teachers and non-teachers) growing so much greater (57% and 152% respectively) than the increase in public school students (11.3%) between 1970 and 2018, the inflation-adjusted cost of educating a student in US public schools increased by 156.2% between 1970 and 2017, from $5,037 to $12,905. With the 156% inflation-adjusted increase in spending per public school pupil and the 30% reduction in the pupil-to-teacher since 1970, have there been any demonstrable educational improvements in student test scores? Unfortunately, No.
As Robert Pondiscio has testified in a statement titled “Higher Pay Won’t Solve Teachers’ Problems”:
When I reflect on my time in the classroom, I don’t think about my paycheck, the staffing, or the per‐pupil funding at my school, which seemed quite generous. Instead, I think about the impediments that stood—and still stand—in the way of teachers being successful … If our hope is that improving teacher pay will improve student outcomes, then we will likely be disappointed. Higher pay does not make a hard job easier to perform. It lifts no burden off a teacher’s shoulders, nor does it add hours to a teacher’s day. I’d like to focus my testimony on a few of the factors that lead to teacher frustration and burnout that higher pay, however well‐intended, does not change. They include, but are not limited to, poor teacher preparation, deteriorating classroom conditions—specifically classroom disorder and disruption—shoddy curriculum, and increasingly the expectation that they will not just teach reading, math, or their subject areas effectively, but also play a quasi‐ therapeutic role in response to students’ behavioral and mental health needs. We are asking teachers to do too many things to do any of them well at any salary. A recent Pew Research Center survey found that 84 percent of American teachers feel there is not enough time during their regular work hours to get all of their work done; two‐thirds (68 percent) feel their jobs are overwhelming … [Schools are not] failing because schools are underfunded. The U.S. spends 38 percent more per students than the average of OECD member countries, and student achievement has remained static despite four decades of increased education spending … Let’s start with teacher training. Nearly half of new teachers leave the classroom within five years. And no wonder … A New York City teacher described in his memoir how two years of graduate school and six months of student teaching left him unprepared for the realities of the classroom. “I had taken courses in lesson planning, evaluation, psychology, and research," he said. "Next to nothing was said about what a first-year teacher most needs to know: how to control a classroom.” He described his ed school experience as—quote—“a mix of folk wisdom, psycho-jargon, wishful thinking, and out-and-out [BS].” Why do good teachers leave the profession? Why do new teachers leave before they have time to reach classroom competence? It’s not primarily the pay. Student behavior is out of control. It creates classroom conditions that are intolerable, makes it impossible to succeed, and drives people out of the classroom. Don’t take my word for it: A 2022 poll from the National Education Association showed that almost half of all teachers report a desire or plan to quit because of school climate and safety. An EdWeek survey last year found that more than 70% of teachers report increases in disruptive behavior in the classroom since 2019. The same Pew study I mentioned earlier revealed that a shocking 40% of American teachers report having had students who were physically violent toward them. Cade Brumley, Louisiana’s State Superintendent of Education, said in a recent interview with the Independent Women’s Forum, "Students who are habitually ungovernable should be removed from teachers' classrooms ... so teachers can actually teach and students can actually learn." It was refreshing to hear a state superintendent say that out loud, and to recognize that disruptive student behavior is classroom cancer. But attitudes like Brumley’s are far too rare. Nearly every teacher has had the experience of asking for help with an unruly student and being asked what they did to trigger the disruption, or being told that students wouldn’t act out if their lessons were more engaging … One RAND study found that nearly every teacher in America—99 percent of elementary teachers, 96 percent of secondary school teachers—draws upon "materials [they] developed and/or selected [themselves]" in teaching English language arts. The numbers are virtually the same for math. Nearly half of teachers in the study reported spending more than four hours per week creating or searching for instructional materials. New teachers spend the most, and at the time they should be developing and mastering their craft … Time spent creating lessons from scratch or searching for materials on the Internet is time not spent analyzing student work, giving students feedback, building subject matter expertise, cultivating strong relationships with students and their parents—all of which are higher-yielding uses of teachers’ time and energy. Worse, studies have consistently demonstrated the teacher-created lessons tend to be below standard and lacking in rigor— another drag on student outcomes. One more example of the increasing demands placed on teachers is the rising emphasis on “social and emotional learning,” or SEL … SEL is an under-discussed change in the role of the teacher, from a pedagogue to something more closely resembling a therapist, social worker, or member of the clergy. The increased focus on SEL is a fundamental shift in teachers’ responsibilities, forcing them into roles that they may embrace reluctantly (or not at all) and are unqualified or unsuited to play, with potential negative consequences for students … No consistent or clear relationship has been found, for example, between teacher credentialing or certification exams and classroom effectiveness … Once again—and emphatically—none of this is to suggest we shouldn’t raise teacher pay. But there is no reason to expect that doing so will solve teacher shortages, or persuade good teachers to stay in the classroom. Again, don’t take my word for it. A 2023 RAND study concluded that “pay increases alone— without improvements in teachers’ working hours or conditions—are unlikely to induce large shifts in teachers’ well-being or intentions to leave.”
In the next essay in this series, we’ll look at evidence on the potential for certain education reforms.