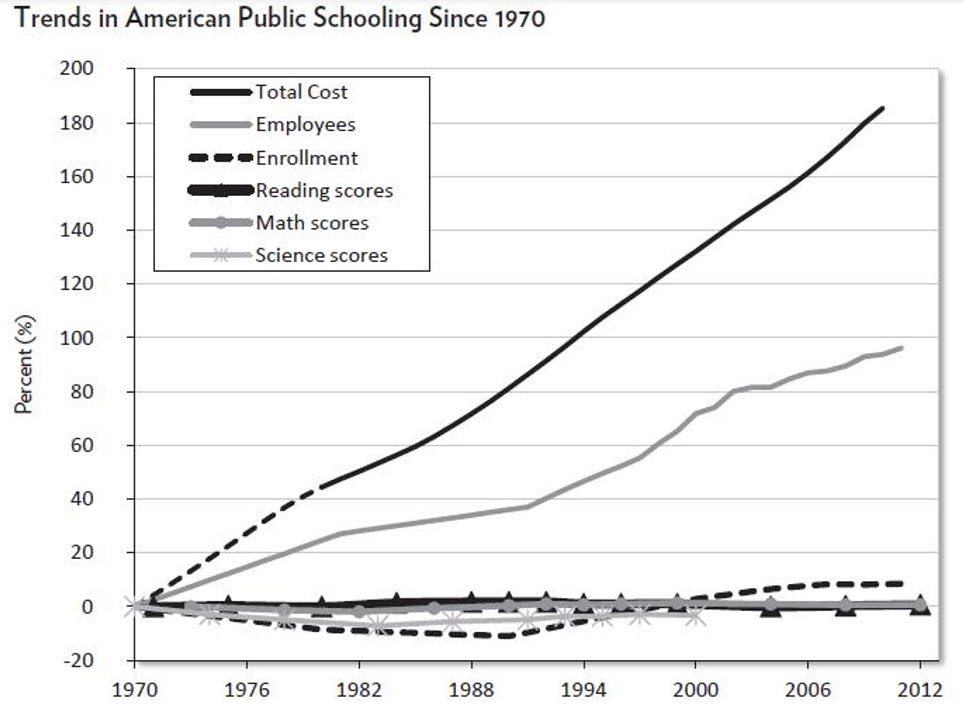
The following graph is from 2012, but it shows the main general trend in public schools since 1970 that continues to this day, namely that while federal education spending has grown dramatically (it was over $100 billion, or about a fifth of Medicare spending ten years ago), those much higher public expenditures on education haven’t resulted in improved student test scores, which remained flat during that time of massive spending growth.
Standardized test scores are important measures because they correlate with future success in life. In 2020, a task force of the faculty senate at the University of California issued a report that recommends the UC system keep standardized tests like the ACT and SAT as admissions requirements. Based on data from tens of thousands of students in the UC system, the report concludes that “test scores are currently better predictors of first-year GPA than high school grade point average.” Scores are also “about as good at predicting” total college GPA and the likelihood a student will graduate. While the “predictive power of test scores has gone up,” the report adds, “the predictive power of high school grades has gone down.” One reason is grade inflation. The faculty task force found that admissions policies play only “a relatively small role” in the underrepresentation of black and Hispanic students at the UC and that instead “the single biggest factor” is “relatively low rates of completion” of required high-school course work among minority students. Test scores enable UC schools “to select those students from underrepresented groups who are more likely to earn higher grades and to graduate on time,” the report notes. “The original intent of the SAT was to identify students who came from outside relatively privileged circles who might have the potential to succeed in university,” the report says.
In 2025, researchers found that policies that make reporting standardized test scores optional actually tend to hurt people who would otherwise greatly improve their chances of college admission is they took the tests and reported their scores. The researchers concluded that:
Under test score optional policies, less advantaged applicants who are high achieving submit test scores at too low a rate, significantly reducing their admissions chances; such applicants increase their admissions probability by a factor of 3.6x (from 2.9 percent to 10.2 percent) when they report their scores. High achieving first-generation applicants raise admissions chances by 2.4x by reporting scores.
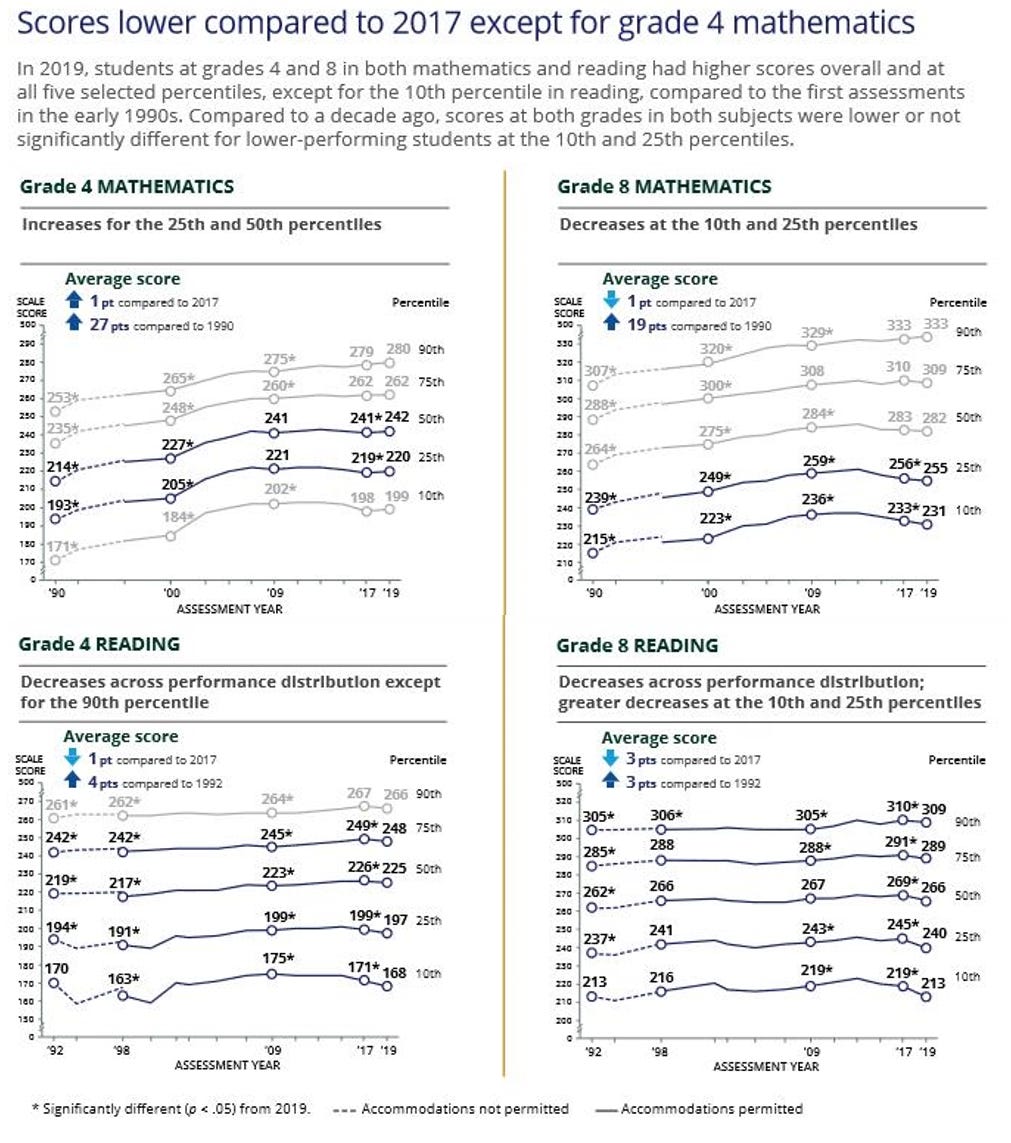
Since the 1970’s, the National Assessment of Educational Progress (NAEP) has monitored the academic performance of 9-, 13-, and 17-year-old students. Recent trends show continued gaps between reading scores in public and private schools (with increasing gaps at age 17), and a trend in which significantly fewer older children are reporting reading for fun. The 2015 results of the NAEP showed declines for the first time since the 1990’s in math scores among fourth and eighth graders, and declines in reading among eighth graders.
The 2019 NAEP assessment results show that scores were up a bit in 4th grade math, but dropped in 4th grade reading, 8th grade reading, and 8th grade math. The drop in 8th grade reading was large, and at more than 3 scale points it was the largest change in scores ever seen for that test, and in a negative direction. While there were some test score gains (particularly in math) between 2000 and 2010, NAEP performance has stagnated since that time, with the 2015 results showing the first widespread declines in NAEP. The bulk of the declines are coming from the lowest scoring students. In 4th grade reading and in 8th grade reading and math, declines were larger for lower-performing students. The highest-achieving students are doing better and the lowest are doing worse than a decade ago.
The NAEP 2019 12th grade numbers (these tests were administered before the onset of COVID-19) showed math performance flat and reading declining noticeably since 2015: just 37 percent of 12th graders were “proficient” in reading and 24 percent in math. The 2019 NAEP science assessments, released in May, 2020, showed that just 36% of American fourth-graders at a proficient level in science and just 22% of high school seniors meet the standard for their grade level. A full 41% of seniors did not even achieve a basic level of performance, meaning they are “unlikely to know key principles, facts, laws, and theories in science.”
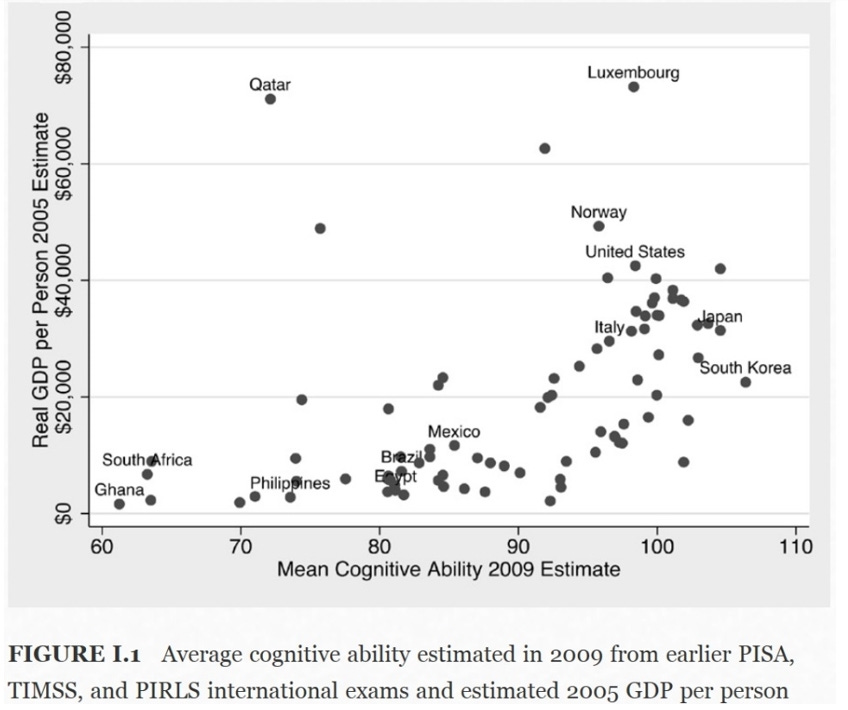
American students score only average in reading and science, and below average in math, on the Programme for International Student Assessment (PISA) test, an internationally standardized test. If American students’ scores on that test were to increase a modest 25 points, it is estimated that the value of that gain would translate to over $40 trillion to the economy over the lifetime of the next generation. Indeed, the higher the mean cognitive ability score of a nation’s citizens, the much more productive their citizens tend to be.
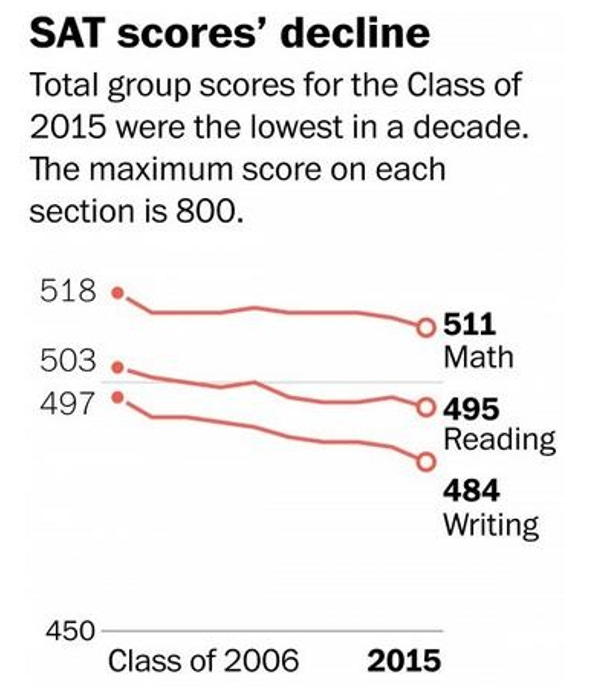
Only 42 percent of students in the class of 2015 who took the SAT standardized test reached a score of at least 1550, a benchmark for college and career readiness. The share was far lower for Hispanic students (23 percent) and African Americans (16 percent). SAT scores have declined over the past decade.
Robert Litan of the Brookings Institution has summarized U.S. student test scores over the decades as follows:
The results from internationally standardized tests are equally disappointing. The two dominant international tests are the Program for International Student Assessment (PISA) and the Trends in International Mathematics and Science Study (TIMSS). PISA, first administered in 2000, tests samples of fifteen-year-old students in reading, math, and science every three years. TIMSS has been administered to 4th and 8th graders since 1995 and tests them in math and science. Both tests are designed to test for achievement, not aptitude, like the SAT or ACT college entrance exams for high school students in the United States. The latest year as of this writing for which results from both tests are available is 2015, and both tell the same story as the U.S.-based NAEP tests tell: while the TIMSS test scores for younger students have improved over the past two decades, the scores for the older students have been flat. The United States ranks, at best, in the middle of the pack of other rich countries. In short, for decades since A Nation at Risk was released, the U.S. K–12 system overall has modestly improved for younger students but is somehow failing to translate those improvements to older students or to those in high school—the student population that is the focus of much of this book. Americans seem to know this already and, by a large majority, fear things will only get worse. A Pew Research survey in March 2019 reported “that 77% of Americans worry about the ability of public schools to provide a quality education to tomorrow’s students, and more expect the quality of these schools to get worse, not better, by 2050.”
As Nat Malkus writes:
Last week’s release of 2023 scores from the Trends in Mathematics and Science Study (TIMSS)—an international assessment measuring fourth and eighth graders in math and science—offers a fresh look at the academic performance of US and international students. The results are grim … First (and perhaps not surprisingly), the pandemic harmed student achievement. Between 2019 and 2023, US math scores cratered, dropping by 18 points for fourth graders and a whopping 27 points for eighth graders—huge declines on a scale where 30 points roughly equates to a year of learning. In science, declines weren’t statistically significant but were in the same direction. Second, the lowest performing students were hit hardest. Looking beneath the averages reveals how students across percentiles fared in both grades and subjects, and the patterns—though not all statistically significant—are consistent and compelling. In fourth-grade math, the scores of students below the 50th percentile dropped precipitously while the 75th and 90th percentile hardly moved at all. This divergence is even clearer in fourth-grade science scores … where the 10th percentile declined by 22 points while the 90th percentile went up by four. In eighth grade, scores fell similarly across percentiles in both subjects during the pandemic. Because TIMSS scores vary so dramatically between percentile groups, the size of these changes can be hard to appreciate on a normal graph like the one above. So, to make the size of these changes clearer, I graphed percentile groups’ scores relative to their scores in 2011 (see chart below).
These declines in standardized test scores coincide with grade inflation in high school.
The company behind the ACT standardized test has found that grade inflation has increased dramatically over the last couple of decades, particularly affecting certain student populations:
The average GPA for high schoolers continued to rise between 2010 and 2022, with evidence of grade inflation in high school math, science, English, and social studies courses, according to a new report released today by ACT, the nonprofit organization that administers the college readiness exam. In a 12-year time frame, the average adjusted math GPA increased from 3.02 to 3.32, a 0.30 grade point change — the highest across all subjects. While average GPAs have risen over the past 12 years across all core academic subjects, this has not corresponded with improvements in other measures of academic achievement, particularly in mathematics,” ACT CEO Janet Godwin said. “We already knew that grade inflation is a persistent, systemic problem, common across classrooms, districts, and states. We now know that grade inflation is happening across the entire curriculum, and is most pronounced for mathematics, as average grades have gone up at the same time as we have seen alarming declines in mathematics scores and other readiness measures. Less reliable grades will make it even more challenging for students to determine their next steps beyond high school. Grade inflation is when the assignment of grades does not align with content mastery ...
Grade inflation was highest in math courses. During the 12-year timeframe for the study, for math, adjusted subject GPA increased from 3.02 to 3.32, a 0.30 grade point change (i.e., increased from a B letter grade, on average, to B+).
The percentage of students in English, math, social studies, and science who reported receiving an A GPA increased by 9.6, 11.4, 10.7, and 12.2 percentage points, respectively, from 2010 to 2022.
Grade inflation occurred for all students.
The rate of grade inflation was similar for students from all family income groups.
Female students experienced more grade inflation than male students in all four subject areas.
In all subjects, Black students experienced the greatest grade inflation when compared to white, Hispanic, and students from other racial/ethnic groups. When comparing Black, Hispanic, and students from other racial/ethnic groups to white students, Black students tended to have greater grade inflation than white students, while Hispanic and students from other racial/ethnic groups tended to have lower grade inflation than white students.
Schools with a higher proportion of students eligible for free or reduced-price lunch experienced higher rates of grade inflation than schools with lower proportions of eligible students.
As described by Jean Twenge in her book iGen: Why Today’s Super-Connected Kids Are Growing Up Less Rebellious, More Tolerant, Less Happy – And Completely Unprepared for Adulthood – And What That Means for the Rest of Us, this grade inflation has been associated with increased reports by high school students that they don’t find school enjoyable, they don’t find the courses interesting, and they don’t find their schoolwork meaningful or important.
Foreign exchange students’ perceptions of time spent on schoolwork by U.S. high school students and class difficulty show foreign students perceive U.S. classes as much easier compared to their classes at home, and that perception has grown over time.
And even with much less homework to do, high school senior today are much less likely to have a driver’s license, date or use alcohol (arguably related to sociality), or have paid work.
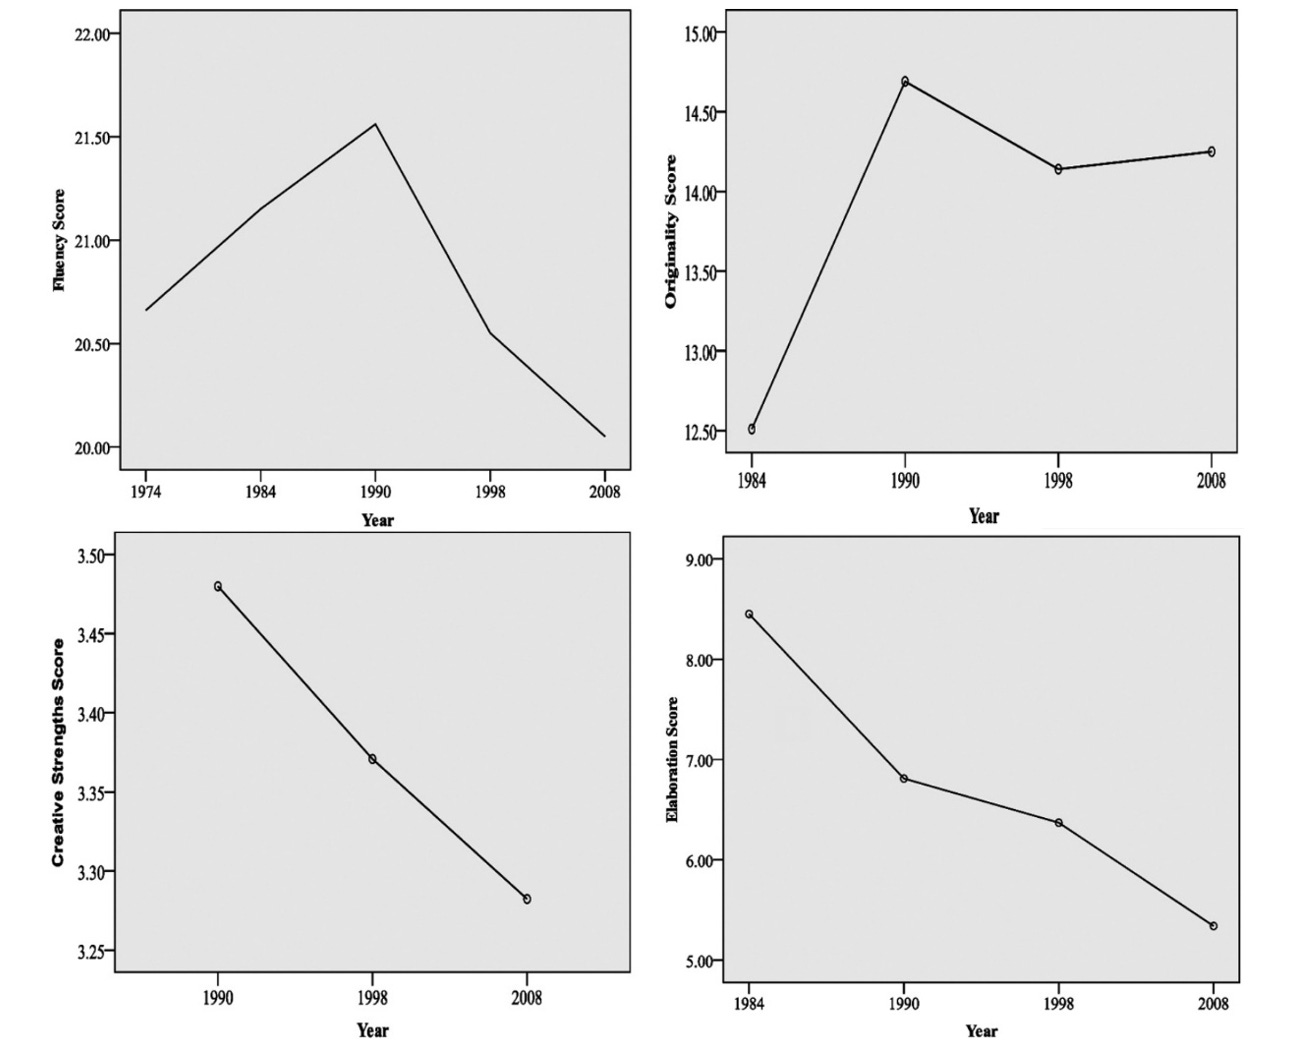
An analysis of the results from the Torrance Tests of Creative Thinking found that American children’s creativity scores have also declined steadily across previous decades. The data show that children have become: “less emotionally expressive, less energetic, less talkative and verbally expressive, less humorous, less imaginative, less unconventional, less lively and passionate, less perceptive, less apt to connect seemingly irrelevant things, less synthesizing, and less likely to see things from a different angle.”
As Campus Reform reports, a 2023 study found a decrease in the IQ scores of younger people that could be attributed to weaknesses in the U.S. education system:
A recent study suggests that, for the first time in nearly 100 years, Americans’ average intelligence quotient (IQ) is declining. The professors who authored the study theorize that the quality of education could play a role in reversing the IQ gains enjoyed by previous generations. The study, published in a spring 2023 edition of Intelligence, measures IQ test results among 18- to 60-year-olds to examine the phenomenon first observed by philosopher James Flynn. Professors from Northwestern University in Evanston, Ill., and the University of Oregon in Eugene explain the Flynn effect: starting in 1932, average IQ scores increased roughly three to five points per decade. In other words, “younger generations are expected to have higher IQ scores than the previous cohort.” Data from the sample of U.S. adults, however, imply that there is a reverse Flynn effect. From 2006 to 2018, the age groups measured generally saw declines in the IQ test used by the study, the International Cognitive Ability Resource (ICAR). Overall declines held true across age groups after controlling for educational attainment and gender, but the study shows that the loss in cognitive abilities is steeper for younger participants. “[T]he greatest differences in annual scores were observed for 18- to 22-year-olds,” the authors write … They continue to theorize that “a change of quality or content of education and test-taking skills” could explain the difference education makes in the IQ of younger versus older Americans … Millennials–the main age group completing their K-12 and college education during the study–have experienced vast changes in the education system. These include students learning to read from an influential but defective curriculum and students receiving inflated grades from their professors.
In the next essay in this series, will look at trends in various education gaps among kids grouped by race and sex.
Links to all essays in this series: Part 1; Part 2; Part 3; Part 4; Part 5; Part 6


