Higher Taxes Can’t Be the Answer – Part 6
The Tax Cuts and Jobs Act of 2017 kept the federal tax system progressive, but in ways that benefitted pretty much everyone.
In recent history, the most significant piece of federal legislation to lower tax rates was the Tax Cuts and Jobs Act of 2017. The Tax Cuts and Jobs Act of 2017 had little effect on overall tax progressivity according to the Tax Policy Center in 2017 and the Joint Committee on Taxation in 2019. The former head of the Council of Economic Advisers under the Obama Administration, Jason Furman, agreed:
In fact, the Joint Committee on Taxation and the Congressional Budget Office found that the 2017 tax cuts made the American tax system slightly more progressive overall and, according to the CBO, the “highest quintile’s share of federal taxes was 0.5 percentage points higher in 2018 than in 2017.”
The 2017 tax cuts clearly continued the progressivity of the U.S. tax code. As Erica York at the Tax Foundation reports:
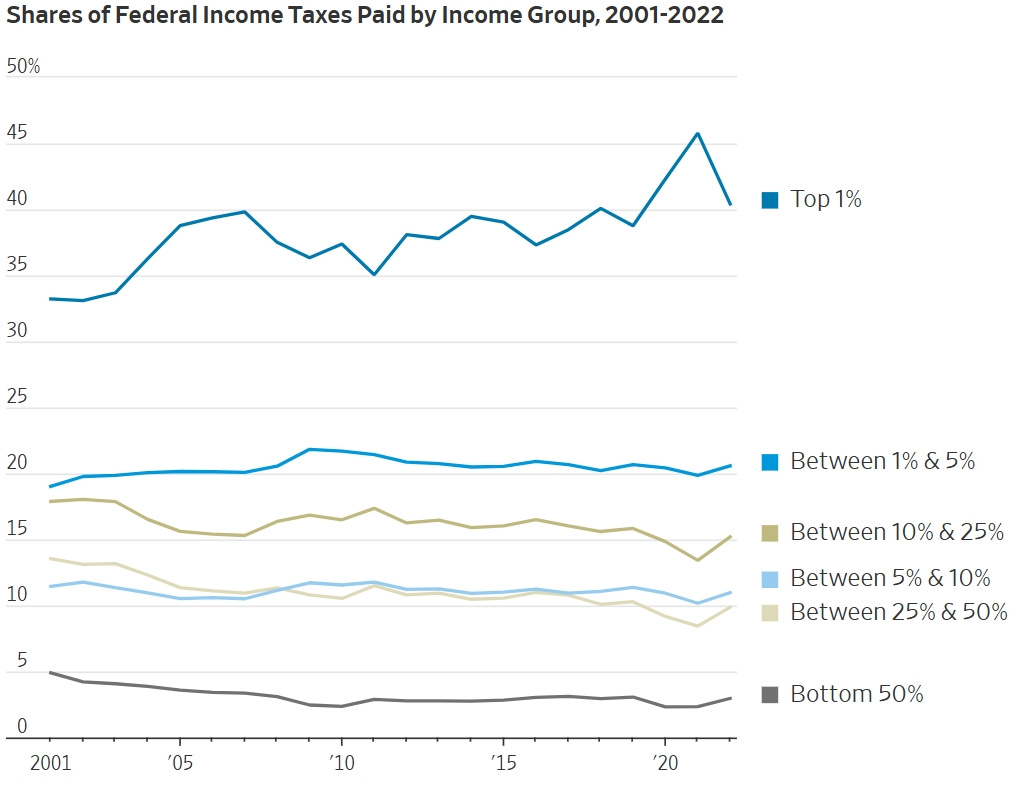
The Internal Revenue Service (IRS) has released data on individual income taxes for tax year 2018, showing the number of taxpayers, adjusted gross income, and income tax shares by income percentiles. The new data shows how taxes changed in the first tax year after passage of the Tax Cuts and Jobs Act (TCJA) in December 2017. The data shows that the U.S. individual income tax continued to be progressive, borne primarily by the highest income earners ... The share of reported income earned by the top 1 percent of taxpayers fell slightly, to 20.9 percent in 2018 from 21 percent in 2017. Their share of federal individual income taxes rose by 1.6 percentage points to 40.1 percent. Since 2001, the share of federal income taxes paid by the top 1 percent increased from 33.2 percent to a new high of 40.1 percent in 2018. In 2018, the top 50 percent of all taxpayers paid 97.1 percent of all individual income taxes, while the bottom 50 percent paid the remaining 2.9 percent. The top 1 percent paid a greater share of individual income taxes (40.1 percent) than the bottom 90 percent combined (28.6 percent).
In sum, the richest Americans took on more of the tax burden. Meanwhile, “average tax rates fell for taxpayers across all income groups.”
What were some of the effects of lowering tax rates for taxpayers across all income groups, and corporate rates?
Within hours of Congress’ passing the Tax Cuts and Jobs Act, major U.S. companies announced they would boost wages and increase hiring.
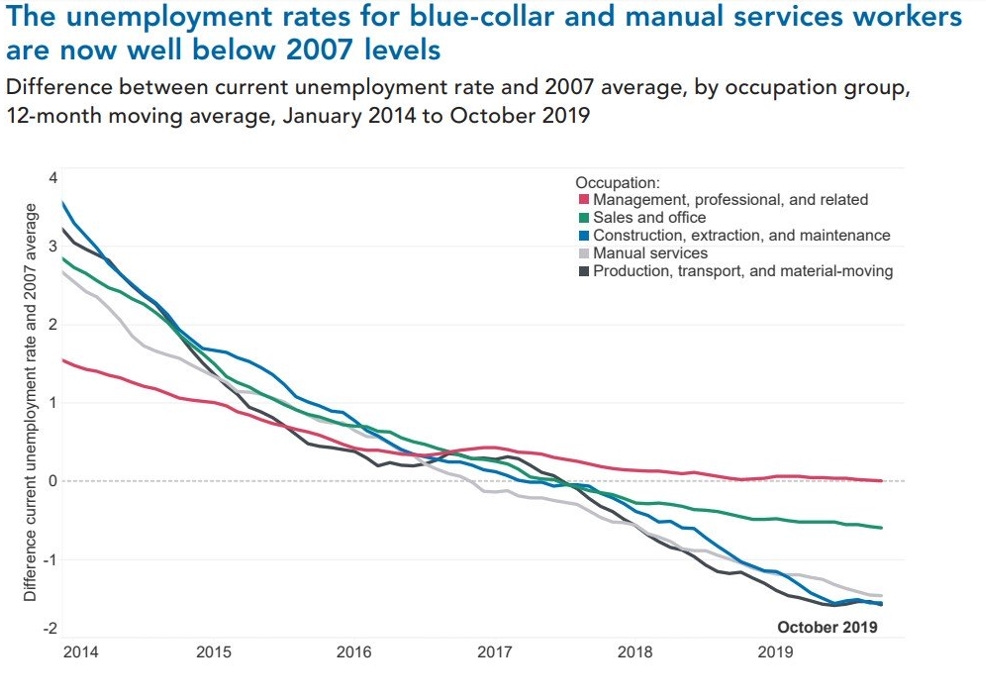
Following the enactment of the Tax Cuts and Jobs Act of 2017, the labor market had significantly improved. The Conference Board, a global business think tank known for regularly publishing labor market indicators, released a report in February, 2020, titled “US Labor Shortages: Challenges and Solutions.” The report states that in the span of just 10 years, “the US economy moved from having the weakest labor market since the Great Depression to one of the tightest in history.” The result has been “critical shortages, especially for blue-collar and manual services employers who are experiencing much tighter labor markets than employers of highly educated white-collar workers -- the exact opposite of prevailing trends in recent decades.” The report states “demand for blue-collar and manual services workers is increasing,” creating labor shortages, and the result is unemployment rates for blue-collar and manual services workers are well below 2007 levels (before the last recession):
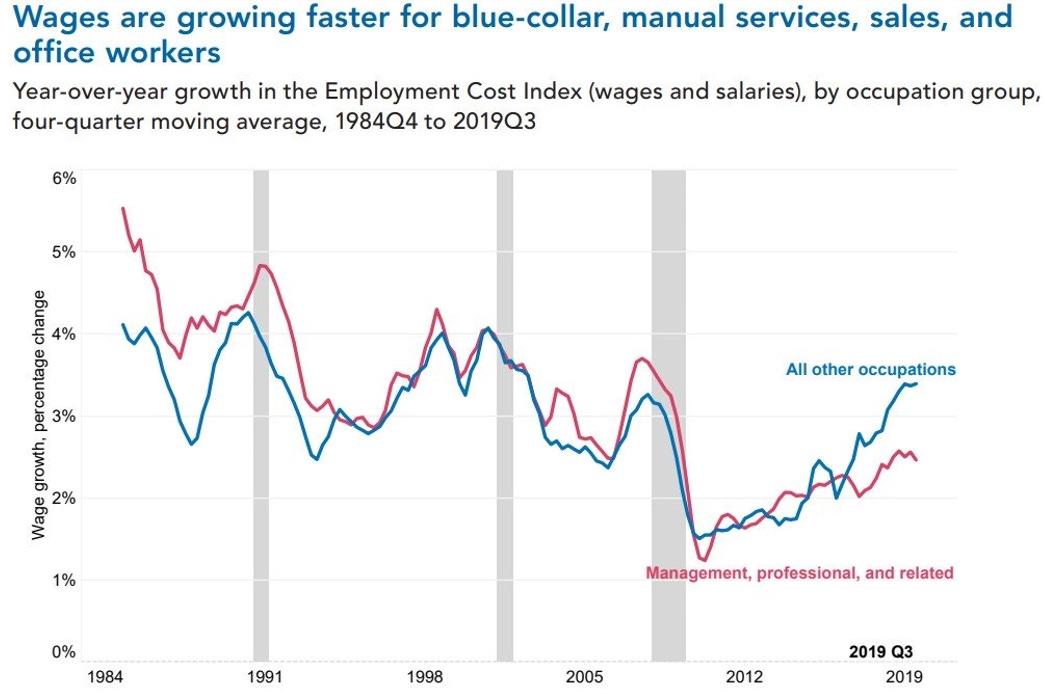
The report found “large improvement in participation rates among black workers and young Hispanic women -- the same groups that have historically seen participation rates well below national averages.” Companies, especially in blue-collar industries, have also “increased their efforts to recruit underserved populations such as women, mature workers, the disabled, immigrants, and veterans.” The report states the “number one solution” companies use to recruit and retain employees is “raising wages and salaries.” As displayed below, wages were then growing fastest for the group that includes blue-collar and manual services workers:
These results particularly benefitted minorities, as wage growth for nonwhite Americans were substantially higher than those of whites.
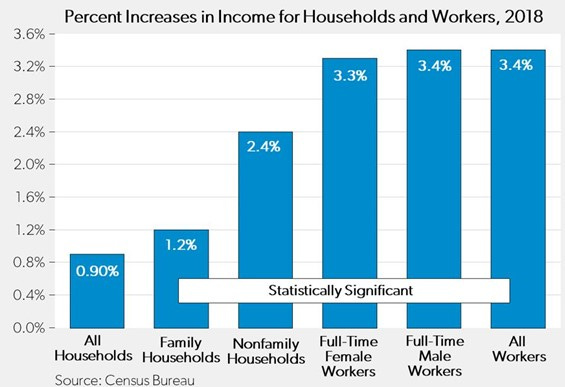
In 2018, all U.S. households and all U.S. workers experienced significant increases in their incomes.
Following enactment of the Tax Cuts and Jobs Act in 2018, as one commentator has pointed out:
It is true that the GOP tax bill will reduce future federal revenue and widen the government’s budget deficits -- but not by large amounts. Before the tax legislation, CBO projected the government would run a deficit of 5.6 percent of GDP in 2030. The Joint Committee on Taxation (JCT) expected the Senate version of the tax bill would widen deficits in the coming years by another 0.5 to 1.0 percent of GDP; the final version is likely to have a similar effect. Increasing future deficits is not ideal, of course. It would be better for the economy if the GOP followed up the tax legislation with bills containing serious entitlement reforms that would narrow future deficits by amounts that are larger than the tax cuts. The combination of the tax legislation with long-term deficit reduction would be strongly pro-growth, and would allow for greater public investments … [To] impl[y] that the primary cause of future deficits is the Republican impulse for tax cutting … is false. The truth is that annually appropriated domestic accounts have been under pressure for many years -- including during the entirety of the Obama presidency -- because of the growth in entitlement spending. Even if the GOP weren’t advancing a tax cut this year, there still wouldn’t be any money available for the kind of public spending [many people] favor[]. Suggesting otherwise only confuses matters and provides an excuse for politicians to delay further an actual and enduring solution to the nation’s fiscal problems.
And as described in the Wall Street Journal in 2019:
the Congressional Budget Office released a 10-year forecast -- the first to assess the effects of tax reform after one year of hard results. Compared with its prereform projection, the CBO now expects annual GDP growth to be almost $750 billion higher by 2027, the last year of its prior forecast. A strong case can be made that tax reform played a predominant role in accelerating GDP growth. While most large economies stagnated last year, a sharp rise in business investment in the U.S. helped drive the economy forward. On the other side of the ledger, the CBO predicts the tax cuts will add $1.9 trillion of additional debt in the coming decade, and that the government will pay about $60 billion more in interest each year as a result. So the bottom line says an extra $60 billion a year buys the U.S. $750 billion in annual GDP … Even focusing solely on tax revenue, the government is on pace to collect more than $120 billion each year from that additional $750 billion of GDP -- much more than enough to cover the additional interest payments. Even if a significant portion of the projected GDP gains since 2017 are not the result of tax reform, the tax cut still pays for itself. Tax reform increases real, inflation-adjusted GDP by $300 billion to $450 billion a year in the coming decade, relative to the CBO’s 2017 projection. Assuming a real growth rate of 1.8% and a real long-term U.S. government interest rate of about 1.2%, the value of that GDP boost dwarfs the amount of debt the government borrowed to finance the tax cuts.
And as was reported in January, 2020:
Pay for the bottom 25% of wage earners rose 4.5% in November from a year earlier, according to the Federal Reserve Bank of Atlanta. Wages for the top 25% of earners rose 2.9%. Similarly, the Atlanta Fed found wages for low-skilled workers have accelerated since early 2018, and last month matched the pace of high-skill workers for the first time since 2010 … Labor Department data paint a similar picture. Average hourly earnings for production and nonsupervisory workers in the private sector were up 3.7% in November from a year earlier—stronger than the 3.1% advance for all employees—implying managers and other nonproduction workers saw a 1.6% wage increase in the past year. The department doesn’t produce separate management pay figures … The labor market for skilled workers is always tighter, but it hasn’t improved as substantially in recent years. The unemployment rate for high school dropouts fell to 5.3% last month from 7.8% three years earlier. The rate for college grads is down to 2% from 2.4% in November 2016, and is slightly elevated relative to the late 1990s and early 2000s.
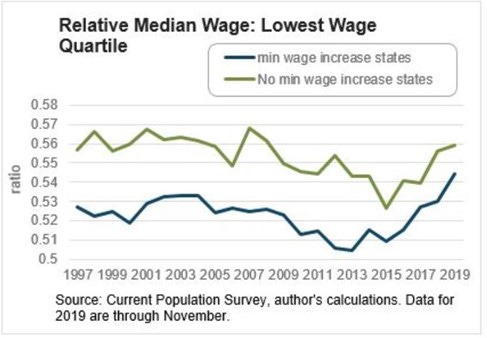
A chart showing this trend can be found here:
And an analysis by the Federal Reserve showed that these wage increases for those in low-wage industries were not due to increases in the mandatory minimum wage (as some had claimed).
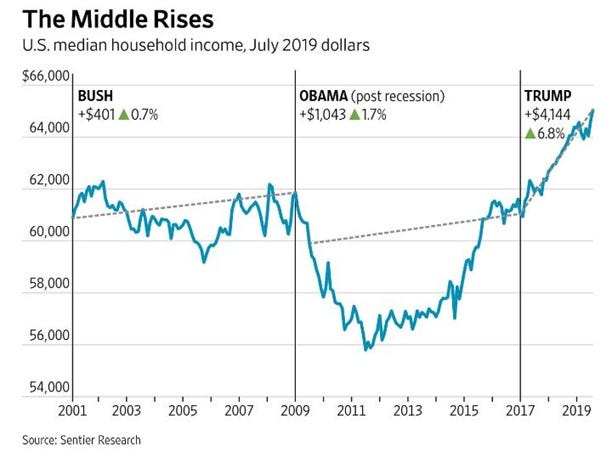
U.S. median household income had also risen significantly since 2017, prior to the COVID-19 pandemic:
As Lawrence Lindsey described the economic upturn during the Trump Administration:
In December 2016, the Fed predicted that 2017 would close at a 4.5% unemployment rate. In fact, it ended at 4.1%. The Fed in 2016 also projected that 2018 would end with 4.5% unemployment, believing further improvement was virtually impossible. But unemployment reached 3.9% in 2018. Ditto for 2019: The Fed predicted 4.5%, but unemployment fell to 3.5% that year, a multidecade low. Under Mr. Trump, the unemployment rate fell to a level the Fed hadn’t even considered. The Fed’s 2016 predictions for GDP were 0.7 percentage points too low for 2017, 0.5 points too low for 2018 and 0.4 points too low for 2019. How do those results compare with the economy’s performance after President Obama’s stimulus package was enacted in 2009? In December 2010 the Fed had to revise up the unemployment estimates it made in 2009 by 0.6% for 2011 and 0.8% for 2012. Growth was even more disappointing. The 2009 forecast overestimated 2011 GDP by 2.6 percentage points. The 2010 prediction for 2011 overshot by 1.7 points, and the prediction for 2012 was 2.5 points too high. In sum, the Obama recovery, which was subpar in virtually all respects, ultimately underperformed the Fed’s expectations in terms of GDP growth and the unemployment rate, while the Trump portion of the recovery consistently outperformed expectations.
Former top economist for the Obama Administration, Jason Furman, has also written that
[t]he U.S. economy did outperform expectations from 2017-19, growing at an annual rate 0.4 percentage point faster than the International Monetary Fund’s October 2016 forecast. This is a larger outperformance than most other Group of Seven countries over that period, suggesting there may have been something U.S.-specific helping to boost growth. Policy did play a role. Before the pandemic struck, the Federal Reserve had already cut interest rates to almost their lowest level in any recession in history. And Congress passed spending increases and tax cuts that were larger than the response to all but two of the recessions since the 1960s.
Casey Mulligan has summarized the economy’s performance under the Trump Administration as follows:
The Fed and the Obama economic team overpredicted growth almost every year from 2010-16. When growth failed to meet their rosy predictions, Mr. Obama’s advisers blamed the poor economic performance on America itself. The country, they said, had lost its innovative spirit and was aging into retirement. It was fundamentally incapable of anything more than tepid growth, insisted the secular stagnationists.
No one in Washington predicted that small business optimism would skyrocket to record levels when Mr. Trump was elected, that real wages would grow again (especially for blue-collar workers), that business formation would hit 20th-century highs, or that poverty and unemployment rates would quickly fall to record lows for Hispanics and African-Americans. And lately, the same crowd doubted that the U.S. economy could so swiftly climb out of the depths of the pandemic recession.
Mr. Obama said in 2012 that reducing America’s corporate-tax rate would create “good jobs with good wages for the middle-class folks.” The next year Lawrence Summers, chairman of Mr. Obama’s economic council, echoed that statement, calling it “as close to a free lunch as tax reformers will ever get.” Then, when they realized that Mr. Trump would actually do it, they changed their tune. When the Tax Cuts and Jobs Act became law in December 2017, the economy predictably took off, bringing millions into the labor force while real business investment surged past Congressional Budget Office projections. As important, the tax law helped ensure that capital investment was deployed more productively.
Mr. Trump also opted for protectionism in international trade, adopting many of the same plays that the Reagan administration did quietly, except now the “opponent” was China rather than Japan and other East Asian tigers. There were real growth costs associated with the tariffs—which are taxes on top of all other taxes and regulations—but they were time limited and their rates were not nearly high enough to offset the growth effects of deregulation and the 2017 tax law.
As James Freeman writes at the Wall Street Journal in 2023:
Economists from Harvard, Princeton, the University of Chicago and the U.S. Treasury report in a new National Bureau of Economic Research paper on “the investment and firm valuation effects of the Tax Cuts and Jobs Act (TCJA) of 2017, the largest corporate tax reduction in the history of the United States.” The authors share a number of findings:
“First, the TCJA caused domestic investment of firms with the mean tax change to increase by roughly 20% relative to firms experiencing no tax change. Second, the TCJA created large incentives for some U.S. multinationals to increase foreign capital, which rose substantially following the law change. Third, domestic investment also increases in response to foreign incentives, indicating complementarity between domestic and foreign capital in production. Fourth, the general equilibrium long-run effects of the TCJA on the domestic and total capital of U.S. firms are around 6% and 9%, respectively. Finally, in our model, the dynamic labor and corporate tax revenue feedback in the first 10 years is less than 2% of baseline corporate revenue, as investment growth causes both higher labor tax revenues from wage growth and offsetting corporate revenue declines from more depreciation deductions.”
The results of the Trump corporate tax reform were more business investment, more growth, more wages for workers—and little impact on government revenue as lower corporate tax rates were offset by an expanding economy … “These are the most convincing estimates of the response of investment to corporate tax rates that I’ve ever seen,” says Harvard’s Jason Furman, former chairman of the Council of Economic Advisers during the Obama administration. He is not among the study authors but describes the findings in a series of posts on X: “Taxes actually do matter... Companies that saw larger reductions in tax rates from the TCJA also experienced larger increases in investment in the years that followed ... Note they find that they increase investment overseas and that this investment is a complement that leads them to increase investment in the United States.”
In 2019, researchers found the following effects of 2017 federal tax cut legislation:
The 2017 Tax Cuts and Jobs Act slashed tax rates on business income and introduced immediate expensing of investments … [W]e investigate the long-run effects of such tax reforms on firm dynamics. We find that they can substantially increase business dynamism, potentially offsetting the large decline in the U.S. startup rate observed over recent decades … [T]he tax reform stimulates firm entry, leading to an increase in labor demand and wages. Related to this is a large boost of the number of firms and of aggregate output, investment and employment.
And as Michael Barone summarized the economic metrics under the Trump Administration:
The macroeconomy during the first three Trump years grew robustly, with real median household incomes rising 9% after near-zero growth from 1999 to 2016. Even more striking, gains in the Trump years were greatest at low rather than high income levels — 4.7% wage growth among the lowest quartile of earners in 2019, with the bottom 90% increasing their share of overall earnings for the first time in a decade. Since the 1980s, Democrats have been lamenting stagnant wages among low earners even as billionaires make dazzling gains. Republicans have sometimes sung the same tune. But the trend continued during the Clinton, Bush, and Obama presidencies. Democrats’ tax increases on high earners didn’t reverse this. Neither did their 2009 stimulus package or 2010 healthcare law. Something else did it, in the years 2017, 2018, and 2019.
As reported in the Wall Street Journal:
Economists from Harvard, Princeton, the University of Chicago and the U.S. Treasury reported in a National Bureau of Economic Research paper on “the investment and firm valuation effects of the Tax Cuts and Jobs Act (TCJA) of 2017, the largest corporate tax reduction in the history of the United States.” The authors shared a number of findings: “First, the TCJA caused domestic investment of firms with the mean tax change to increase by roughly 20% relative to firms experiencing no tax change. Second, the TCJA created large incentives for some U.S. multinationals to increase foreign capital, which rose substantially following the law change. Third, domestic investment also increases in response to foreign incentives, indicating complementarity between domestic and foreign capital in production. Fourth, the general equilibrium long-run effects of the TCJA on the domestic and total capital of U.S. firms are around 6% and 9%, respectively. Finally, in our model, the dynamic labor and corporate tax revenue feedback in the first 10 years is less than 2% of baseline corporate revenue, as investment growth causes both higher labor tax revenues from wage growth and offsetting corporate revenue declines from more depreciation deductions.” The results of the Trump reform were more business investment, more growth and more wages for workers.
As Phil Gramm summarized, “Any discussion of the merits of the 2017 tax cut must begin with the corporate tax cut, which took America from a 35% corporate tax rate, the highest in the world, to 21%, the mid-range of global corporate tax rates. All available evidence suggests that the corporate tax cut and reductions in regulatory burden, which were implemented at the same time, caused real gross national product to rise by 3 percent in 2018, the highest growth rate in 13 years. Yet far more impressive than the 3 percent growth rate, median household income soared, and the poverty rate plummeted.”
As the Wall Street Journal wrote in December, 2024:
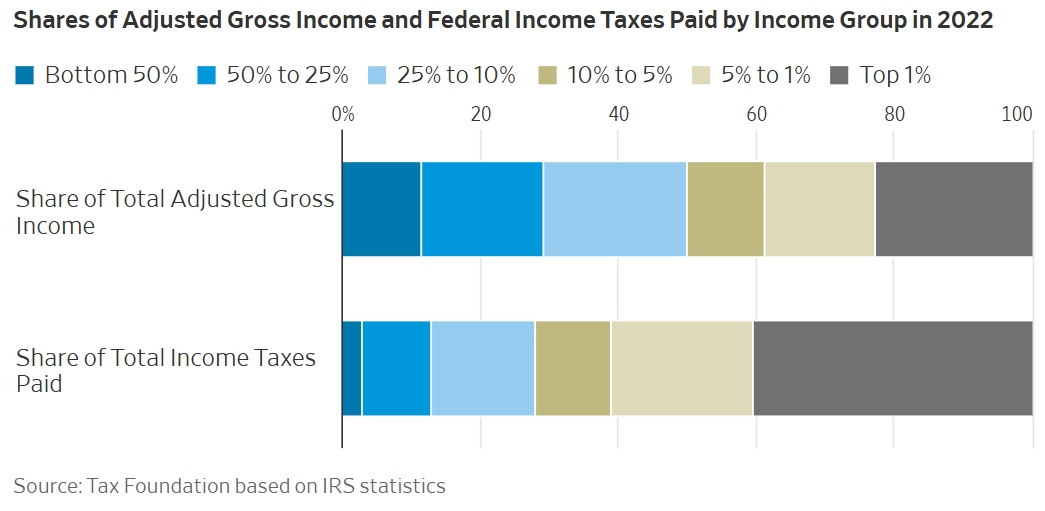
Here’s a statistic to remember next year, as Congress debates extending President Trump’s 2017 tax cuts: The top 1% of income-tax filers provided 40.4% of the revenue in 2022, according to recently released IRS data. The top 10% of filers carried 72% of the tax burden. Self-styled progressives will never admit it, but U.S. income taxes are already highly progressive … To understand the 2022 numbers in greater detail, let’s break them out by cohort.
The top 1%: This group includes 1.5 million tax returns with adjusted gross incomes (AGI) above $663,000. These people made up 22.4% of the country’s total reported earnings, yet their share of income taxes paid was nearly double that at 40.4%. (See the nearby chart.) Their average federal tax rate was 26.1% … [I]s paying two times more in taxes than your share of income “fair”? We’d say it’s closer to punitive, especially since many of these taxpayers are “rich” for only a narrow window of their highest-earning years.
Between the top 1% and 5%: About 6.2 million returns above $262,000 but below $663,000. These people had 15.9% of total earnings, while contributing 20.6% of income-tax revenue. Average tax rate: 18.8%.
Between the top 5% and 10%: About 7.7 million returns above at least $179,000 but below the previous the top 5%. Their share of earnings, 11.1%, almost matched their share of taxes paid, also 11%. Average tax rate: 14.3%.
Between the top 10% and 25%: About 23.1 million returns above at least $100,000. Share of income: 20.5%. Share of tax: 15.2% Average tax rate: 10.7%.
Between the top 25% and 50%: About 38.5 million returns above at least $50,000. Share of income: 18.6%. Share of tax: 9.9%. Average tax rate: 7.7%.
The bottom 50%: About 76.9 million returns with earnings under $50,000. Share of income: 11.5%. Share of tax: 3%. Average tax rate: 3.7%.
Add all this up, and the top quarter of earners reported 69.9% of all income in 2022 but paid 87.2% of all income taxes. Despite the 2017 reform’s modest cuts in individual tax rates, the tax code continues to soak the upper middle class as well as the rich. And this doesn’t include state and local tax rates. Two other notes on the data: First, these figures overstate the actual income-tax burden shouldered by the bottom 50%, because “refundable” credits paid to those with no tax liability are treated as spending and aren’t reflected in the IRS numbers. This means tens of millions of Americans have income-tax rates that are effectively negative—that is, they get what amounts to a welfare check from the government. Second, these numbers only cover the income tax. The IRS figures don’t include payroll taxes on workers with lower earnings, including to support Medicare and Social Security. But other analyses show that although including payroll taxes somewhat modifies the progressivity of the tax code overall, the basic picture doesn’t change.
As Brian Riedl writes, it is a fallacy that declining taxation is the reason the federal government runs massive annual deficits:
Nor are future deficit projections driven by declining tax revenues. Since 1960, tax revenues have typically remained close to their average level of 17.4% of GDP. And over the next 30 years, tax revenues are projected to range between 17.9% and 18.9% of GDP, depending on whether the 2017 tax cuts are extended. However, federal spending—which has averaged 20% of GDP since 1960—has already risen to a current level of 24% of GDP and is projected to leap as high as 32% of GDP over 30 years (see Figure 7).
Links to all essays in this series: Part 1; Part 2; Part 3; Part 4; Part 5; Part 6; Part 7; Part 8


