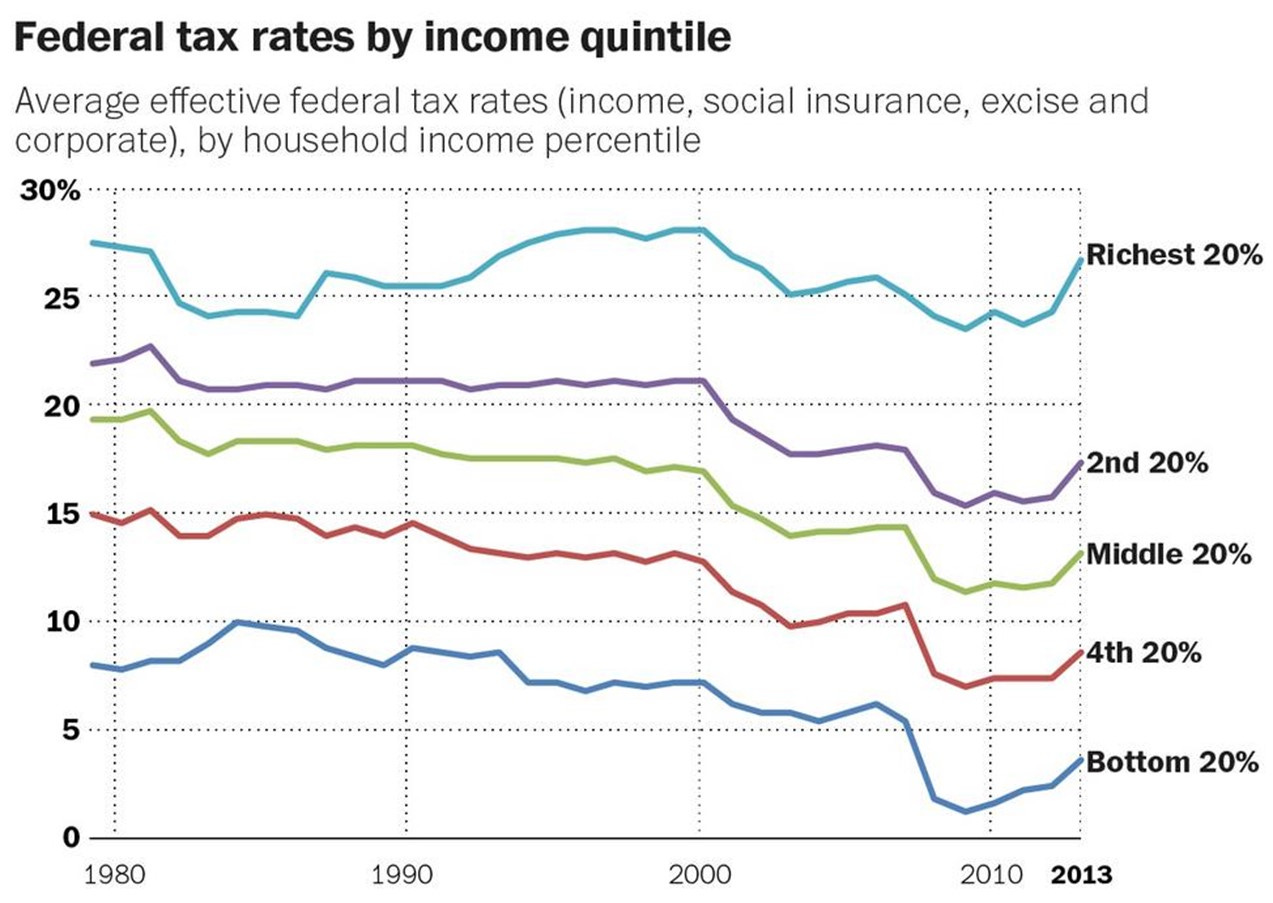
Federal tax rates are already steeply progressive, meaning the average tax rate increases steeply as income rises.
As a result, top earners already pay a largely disproportionate share of federal taxes.
In 2014, the top 400 U.S. federal taxpayers paid almost as much in federal taxes as the bottom 50 percent of all U.S. taxpayers, and the top 0.001 percent of U.S. taxpayers pay more federal taxes than the bottom 50 percent.
As explained by Phil Gramm and John Early, by 2020:
The nearby graph shows that taxes actually paid, as a percentage of income earned and received in transfer payments, rise steadily from 5.1% in the bottom quintile of households to 39.6% in the top 1%. While it’s too small to show on the graph, the top 0.1% of earners, which included 127,586 households in 2017, had an average gross income of $2,892,434 and paid $1,304,769, or 45.1%, in federal, state and local taxes. To be sure, the average household in the top 1% retains almost 18 times as much income after taxes and transfer payments as the average bottom-quintile household. But it pays more than 219 times as much in taxes. Even at the very top of the income distribution, the average household in the top 0.1% has more than 31 times as much income as the average bottom-quintile household, but pays almost 482 times as much in total taxes. Data from the Organization for Economic Cooperation and Development show that the U.S. has the most progressive income tax system in the world, with the top 10% of earners paying 45% of all income taxes, including Social Security and Medicare taxes, compared with only 28% in France and 27% in Sweden. If the U.S. government spent as large a share of gross domestic product and had the same tax structure as France, the top 10% of U.S. earners would pay about what they pay now in income taxes, but the bottom 90% would see their taxes almost double. Although the last OECD tax comparison was made in 2015, before the Tax Cuts and Jobs Act of 2017, the Joint Committee on Taxation has shown that the U.S. tax system, in terms of proportionate tax burden, became more progressive after the 2017 tax cut than it was in 2015.
And as Phil Gramm and Mike Solon wrote in October, 2021:
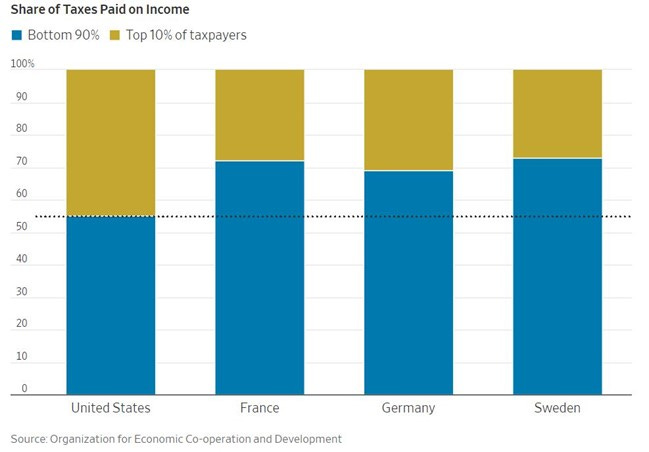
Organization for Economic Cooperation and Development data show that the top 10% of American households earn about 33.5% of all earned income but pay 45.1% of all income taxes, including Social Security and Medicare payroll taxes. That progressivity ratio of 1.35 is far higher than in any other country. The ratio in France is 1.10. In Germany it’s 1.07, and in Sweden an even 1. In the last OECD study, in 2015, the top 10% of earners in the U.S. paid 45% of all income taxes. In France, the top 10% only paid 28%. In Germany they paid 31% and in Sweden 27%. Conversely, the bottom 90% of earners in the U.S. paid 55%. The bottom 90% of earners in France paid 72%. In Germany it was 69% and in Sweden 73%.
The following chart shows the percentage share of federal income taxes paid by the top 10 percent and bottom 90 percent over time.
The following charts also show a rise in federal tax payments by the richest quintiles over time.
The idea behind progressive taxation is, as Keen and Slemrod describe, the “ability-to-pay principle,” namely:
the idea that the tax burden any individual bears ought to be related to their level of economic well-being. This idea runs through tax history. The first tax law in the American colonies—Virginia in 1634—spoke of assessing each man “[A]ccording to his estate and with consideration of all other his abilityes whatsoever.” That is, each person’s tax burden should be related to their ability to bear the sacrifice of material well-being it implies … But two tricky steps are required to put the idea into practice. The first is determining exactly what someone’s ability to pay is. It being impossible to assess directly the happiness that their material circumstances give people, the natural approach is to judge the appropriate level of taxation using some external indicator of their material well-being [like] how many windows their home has … The second tricky step, supposing we are able to identify everyone’s ability to pay (observed or potential), is deciding precisely how the tax burden should vary across those differing abilities to pay … Today’s income tax is simply the point that this continuing process happens to have now reached.
Beyond those practical problems is another that constitutes a sort of internal contradiction: when tax revenues depend so much on top earners, the government’s revenues disproportionately rely on the increased prosperity of top earners, which can lead to policies that favor certain industries and thereby increase income inequality.
And progressive tax policies incur the same “excess burden” effects discussed in our last essay, in which people will tend to limit their efforts and consequence earnings in order to avoid entering into the next tax highest bracket, thereby denying themselves and others the benefit of their efforts to provide yet more goods and services.
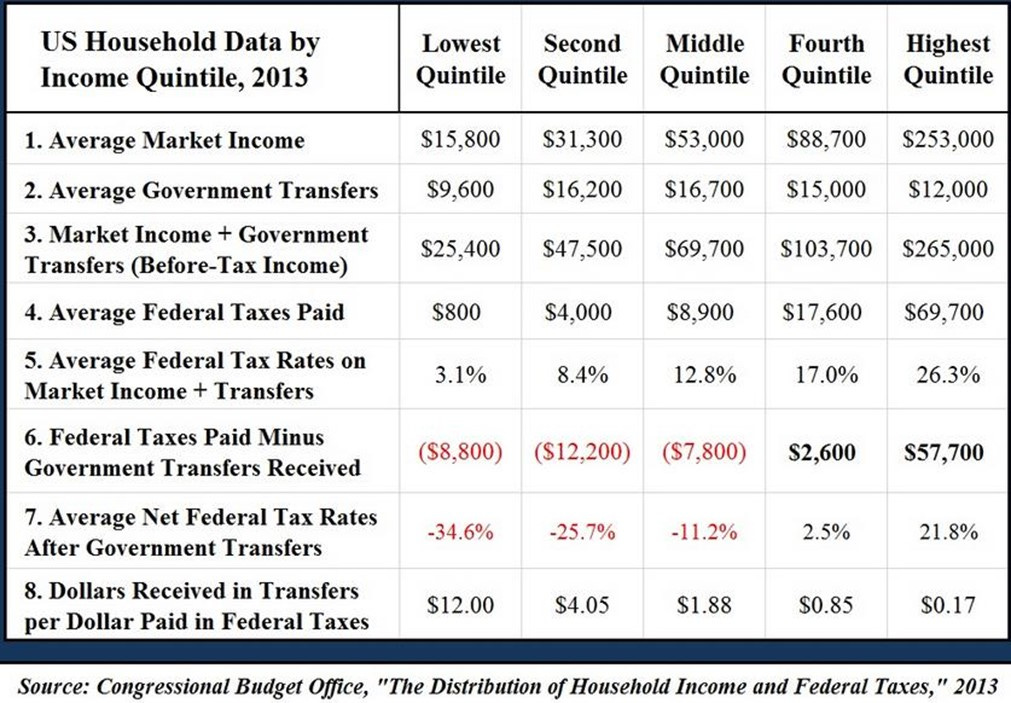
There’s also the problem in which, if some pay lots of taxes and others pay none or very little, those who pay no or little taxes will have much less incentive to consider the costs of taxation when voting on tax policies. And according to the Congressional Budget Office, in 2013, the top 1% of households paid an average of 34% of their income in federal taxes. To compare, the middle 20% of households paid only 12.8% of their income in taxes. Moreover, taxes on the rich are much higher than they’ve been in previous years. Between 2008 and 2012, the top 1% of households paid an average tax rate of 28.8%. However, in 2013, this figure spiked to 34%, as a result of tax increases. According to the Congressional Budget Office, the federal tax system, as of 2014, was “the most progressive it has been since at least the mid-1990s.”
The CBO study shows that the bottom three income quintiles representing 60% of U.S. households are “net recipient households” (that is, they receive more in transfer payments than they pay in federal taxes), the second-highest income quintile pays just slightly more in federal taxes ($17,600) than it receives in government transfer payments ($15,000), while the top 20% of America’s “net payer households” finance almost 100% of the transfer payments to the bottom 60%, as well as almost 100% of the tax revenue collected to run the federal government.
Researchers at the University of Chicago have also found that, by 2024, the federal tax system had become more redistributive, not less, over the last 50 years, meaning progressively more federal taxes are being taken from some to give to others through tax transfers. The researchers concluded “While there are some differences in their estimates of the effects at the top of the distribution, there is broad agreement that there have been large increases in net transfer rate to the bottom, and the size of those increases swamp any changes at the top. This is robust across different methodologies and datasets. Second and consistent with this finding, the tax and transfer system has become more redistributive over the last half century, with much of that increase occurring in the last several decades.”
The number of “nonpayers” of federal income tax in 2018 as a share of all taxpayers was nearly 44%, or more than double the roughly 20% of “nonpayers” between 1950 and 1990.
From Wars to Welfare
As was mentioned in a previous essay, the American income tax regime grew out of the need to fund wars. But as Keen and Slemrod further explain, war produced a tax system that never went away with the wars, but was instead redirected to pay for various welfare programs (benefiting those who didn’t pay taxes):
In the United States, apart from an upward blip during the Civil War, the tax ratio (looking just at federal taxes) remained under 5 percent. But tax ratios jumped sharply with the First World War and stayed in the low 20s for the United Kingdom and between 5 and 10 percent in the United States until World War Two. Tax ratios in both countries then again skyrocketed, but this time hardly came down after the war … The role of war leaps out when looking at broad trends over the past century or so. In both the United States and the United Kingdom, tax ratios peaked in the two world wars, with the revolutionary wars in Britain and the civil war in the United States also showing upward jumps. There was a ratchet effect from both world wars: taxes going up in wartime, but then not coming down much after … The clear ratcheting up of the size of government in the United Kingdom and the United States after the First and, especially, Second World Wars marks the transition from a warfare state, in which the main purposes of taxation were to fund defense spending and to deal with debt accumulated in past wars, to a welfare state … Even that can be cast as akin to war. Introducing his People’s Budget of 1909, which raised taxes on the wealthy to fund new social welfare programs, Lloyd George said: “This is a war Budget. It is for raising money to wage implacable warfare against poverty and squalidness.”
As Keen and Slemrod write, the jump from warfare to welfare was initially aimed at those who had actually engaged in the warfare, and survived:
[T]ax ratios jumped during and remained high after the two world wars; the question is why these increases were to a large degree sustained. Mass mobilization may be a large part of the answer, creating and bringing together two blades of a pair of scissors. One was the vast increase in the state’s capacity to extract resources, without which it could not maintain large armies in the field … The other blade was a strong political and social imperative that those who had done the fighting—the ones mobilized—should find some benefit in the peace.
But whereas the original motivation was to transfer some tax away from war to benefit those who fought in it, that motivation was soon redirected to the many others who could vote, and who wanted some benefits, too, even if they weren’t paying taxes themselves. As Keen and Slemrod write:
[I]n 1852, Charles Babbage—taking time off from inventing the computer—was terrified by his calculation that 850,000 of the one million voters in Britain were below the income tax threshold: “Amidst the political errors of the present century, I know of none possessing so truly revolutionary a character … none which, although seemingly fatal only to the rich, is in reality more fatal to all industry.”
Keen and Slemrod describe the quick progression from a progressive tax policy to a welfare state policy:
From seeing income as a good indicator of ability to pay tax, it is a short step to seeing it as an indicator of possible need to receive payment … Income-related benefits emerged after the Second World War as key measures of social support … Increasingly, tax administrations are finding themselves not only collecting money from some but also giving it to others.
Today, the “war on COVID” and its associated stimulus and welfare entitlement spending programs (explored in a previous essay) are further entrenching and expanding the income tax system.
Links to all essays in this series: Part 1; Part 2; Part 3; Part 4; Part 5; Part 6; Part 7; Part 8


