Higher Taxes Can’t Be the Answer – Part 8
When states enact higher taxes, people tend to move to other states.
Finally, let’s explore what tends to happen when individual states, as opposed to the federal government, increase taxes. Tax increases imposed by states would have the same negative effects as federal tax increases, but unlike federal tax increases, state tax increases could be avoided by moving to other states. And the evidence is clear that more onerous state tax polices lead to migrations out of those states.
As Mark Perry and others have observed:
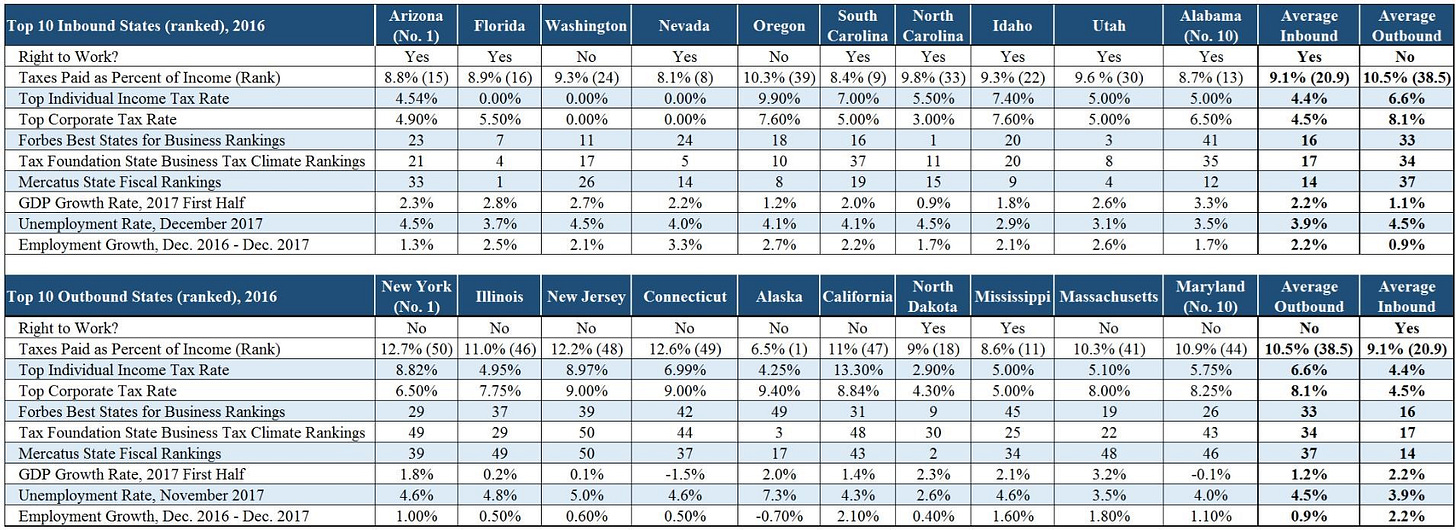
The table [below] summarizes a comparison between the two groups of US states (top five inbound and outbound) on nine different measures of economic performance, labor market dynamism, business climate, tax climate and fiscal health for those ten states. And on each of those nine measures, it does appear that the top five inbound states are on average out-performing the top five outbound states, suggesting that migration patterns in the US do reflect Americans “voting/moving with their feet” from high-tax, business-unfriendly, economically stagnant states to lower-tax, business-friendly, economically vibrant states … [T]he evidence suggests that Americans are moving from states that are relatively more economically stagnant, Democratic-controlled fiscally unhealthy states with higher taxes, more regulations and with fewer economic and job opportunities to Republican-controlled, fiscally sound states that are relatively more economically vibrant, dynamic and business-friendly, with lower tax and regulatory burdens and more economic and job opportunities.
The result is the same when one looks at the total tax burden in each state, measured as the percentage of a state’s income that goes to taxes for state and local governments (income taxes, property taxes and sales taxes). Looking at the total tax burden:
four of the top five outbound states (Illinois ranked No. 46, Connecticut at No. 49, New Jersey at No. 48, and California at No. 47) were among the five US states with the highest tax burden -- New York was No. 50 (highest tax burden). The average tax burden of the top five outbound states was 11.2%, with an average rank of 43.2 out of 50. In contrast, the top five inbound states have an average tax burden of 8.7% and an average rank of 16.6 out of 50. As would be expected, Americans are leaving states with some of the country’s highest overall tax burdens (IL, CT, CA and NJ) and moving to states with lower tax burdens (TN, SC and AZ).
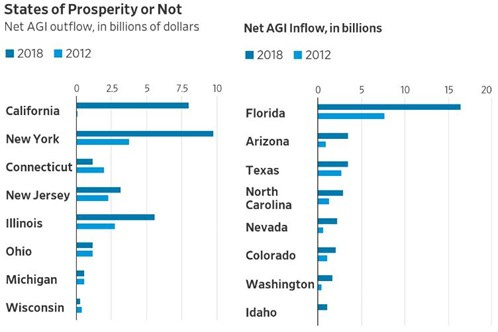
Similar results occur when Census Bureau data is used:
Updated figures can be found here and here.
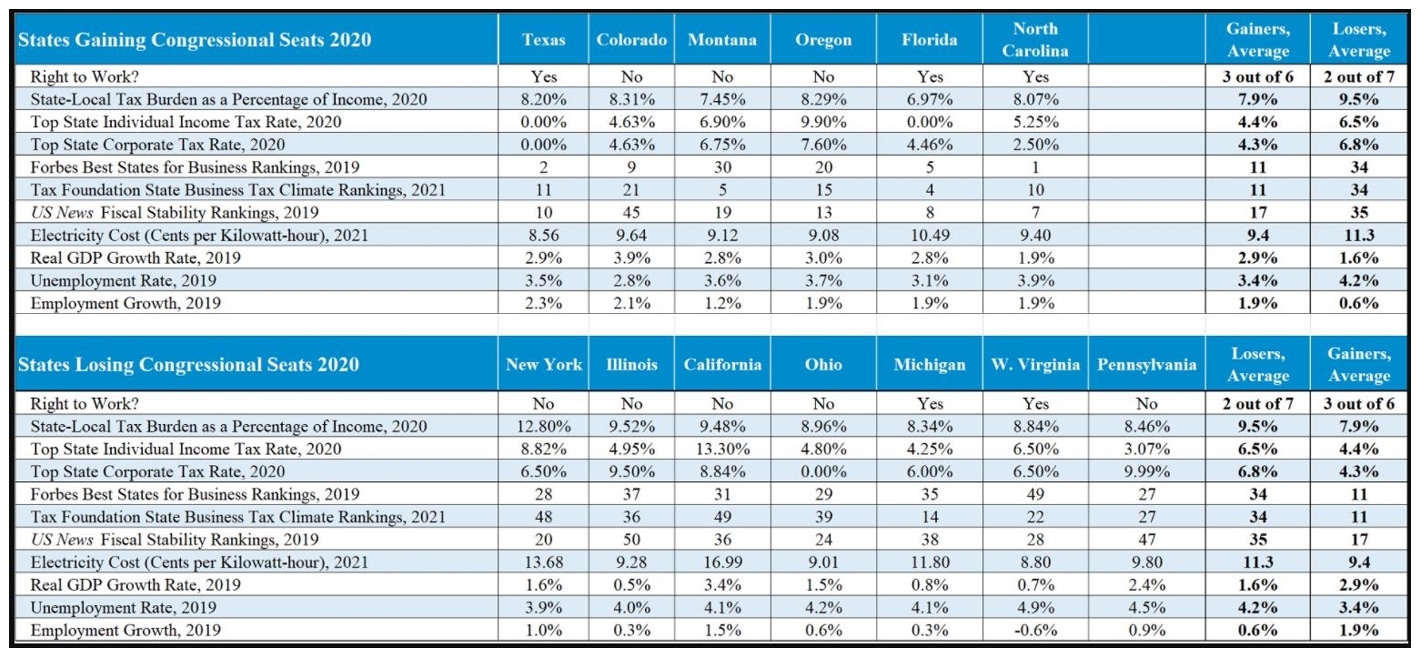
Regarding the 2020 Census, Mark Perry asked the question “The six states that gained congressional seats vs. the seven states that lost seats: How do they compare on a variety of measures?” and summed up his reply as follows:
Based on population changes between 2000 and 2020 recorded in the 2020 Census that will be reflected in changes in House seats, the migration patterns of US households (and businesses) followed the predictable patterns that have been documented in previous [Carpe Diem] studies. To answer the questions posed above, there are significant differences between the six states that gained House seats and seven states that lost seats when they are compared on a variety of 11 measures of economic performance, business climate, tax burdens for businesses and individuals, fiscal stability, electricity costs, and labor market dynamism. There is empirical evidence that Americans and businesses “vote with their feet” when they relocate from one state to another, and the evidence suggests that Americans are moving away from economically stagnant, fiscally unhealthy states with higher tax burdens and unfriendly business climates with higher energy costs and fewer economic and job opportunities, to fiscally sound states that are more economically vibrant, dynamic and business-friendly, with lower tax and regulatory burdens, lower energy costs and more economic and job opportunities. And the fact that those population shifts are reflected in changes in Congressional delegations every ten years is an effective way to reward economically successful, low-tax, business-friendly states like Texas and Florida and punish economically stagnant, high-tax, business-unfriendly states like New York and California. Let’s hope for even more changes in House seats ten years from now in 2030 as states might better learn the economic lesson that they have to compete to attract and retain businesses, residents, and workers.
And as the Wall Street Journal has reported in January, 2020:
The Census Bureau and IRS last week [January, 2020] also released state population growth and income migration data for 2018 that show the exodus from high-tax to low-tax states is accelerating. Four states have lost population since 2010 including West Virginia (-3.3%), Illinois (-1.2%), Vermont (-0.3%) and Connecticut (-0.2%), but 10 experienced declines last year. New York was the biggest loser as a net 180,000 people left for better climes. Over the last decade New York has lost more of its population to other states (7.2%) than any other save Alaska (8%), followed by Illinois (6.8%), Connecticut (5.6%) and New Jersey (5.5%) … [W]hat do these states have in common? Large tax burdens and politically powerful public unions.
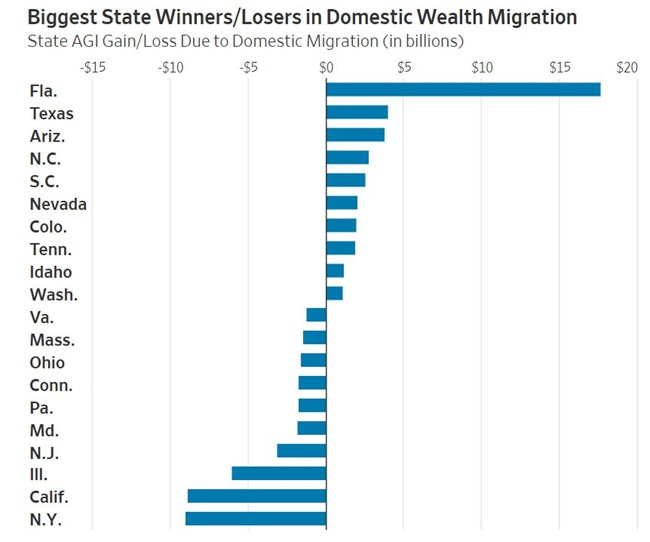
And as the Wall Street Journal further reported in June of the following year (2021):
New IRS data compiled by research outfit Wirepoints illustrate the flight from high- to low-tax states. The chart [below] shows the adjusted gross income (AGI) that states lost or gained from population migration in 2019 as a share of their total AGI. States in the Sun Belt and Mountain West generally gained income while those in the Northeast and Midwest lost income. Retirees in the Midwest and Northeast are flocking to sunnier climes. But notably, states with no income tax (Florida, Nevada, Tennessee and Wyoming) made up four of the 10 states with the largest income gains. On the other hand, five of the 10 states with the greatest income losses (NY, Connecticut, New Jersey, Minnesota, California) ranked among the top 10 states with the highest top marginal income tax rates.
This concludes these series of essays on American tax policy.
Links to all essays in this series: Part 1; Part 2; Part 3; Part 4; Part 5; Part 6; Part 7; Part 8


