Data on Racism – Part 6
Data on race and the American South, and housing and race.
In this essay, we’ll look at data on race and the American South, and housing and race.
The American South and Race
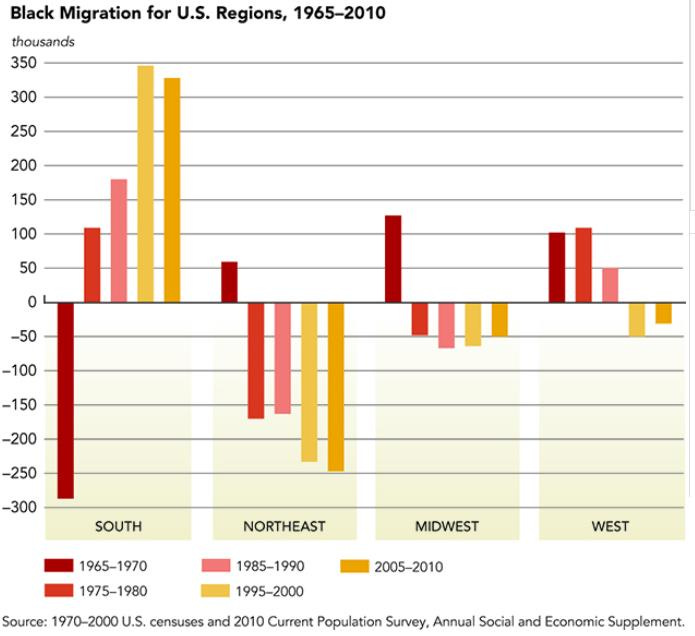
Over the last several decades, in a reversal of prior historical trends, blacks have been migrating to, not from, Southern states, which now offer more economic opportunities. (Political analyst Michael Barone has written that this migration contributed to the 2016 Democratic presidential candidate’s losing the formerly “blue wall” states of Ohio, Wisconsin, Michigan, and Pennsylvania, as more blacks moved from those states to the South.)
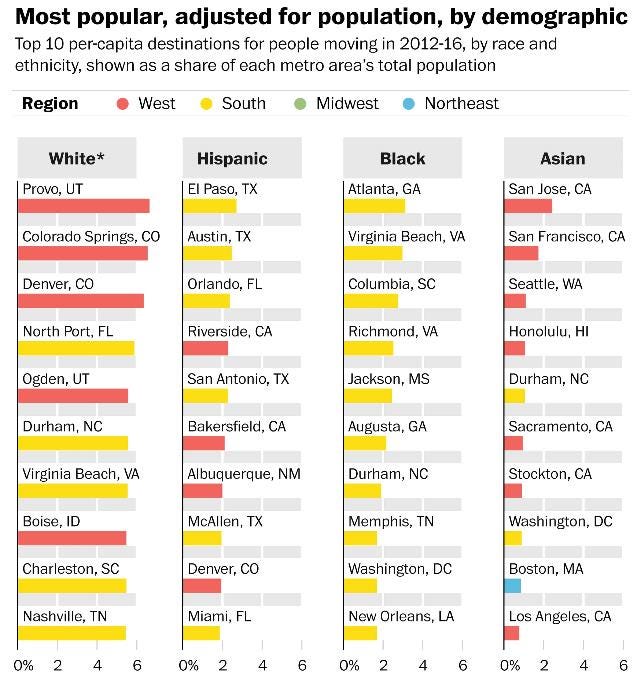
Southern states are the most popular destinations for blacks and Hispanics who are moving to better opportunities.
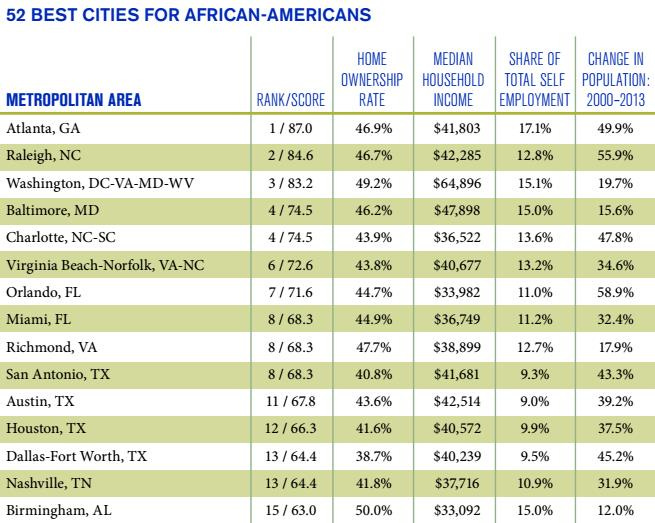
Among the best cities for blacks, as ranked by the home ownership rate, median household income, and the share of total self-employment, almost all the best cities are in the South.
As Tim Carney points out:
It might be jarring, then, for these New York-based commentators to open an ideologically friendly news outlet in Austin and see this headline: “People of color make up 95% of Texas’ population growth.”
Texas gained the most black people, nearly 700,000, of any state in the country. Georgia and Florida were second and third place, increasing their black populations by 450,000 and 390,000, respectively. All three states were governed by Republican governors with Republican-run legislatures throughout the decade. Texas saw its black population grow by 23% while Georgia and Florida saw 15% and 13% growth respectively.
The largest Democrat-run states, New York, Illinois, and California, saw nothing of the sort. Illinois’s black population shrunk. California and New York saw such small black population growth that black people became even smaller minorities in those states.
To be sure, Florida also saw its non-Hispanic black population shrink relative to the entire population, but only because the state added 1.47 million Hispanics over the decade.
In short, if you were a person of color in the United States over the past decade, especially a black person, looking to move or have children, the GOP-run states of Texas, Florida, and Georgia were the most attractive places to live.
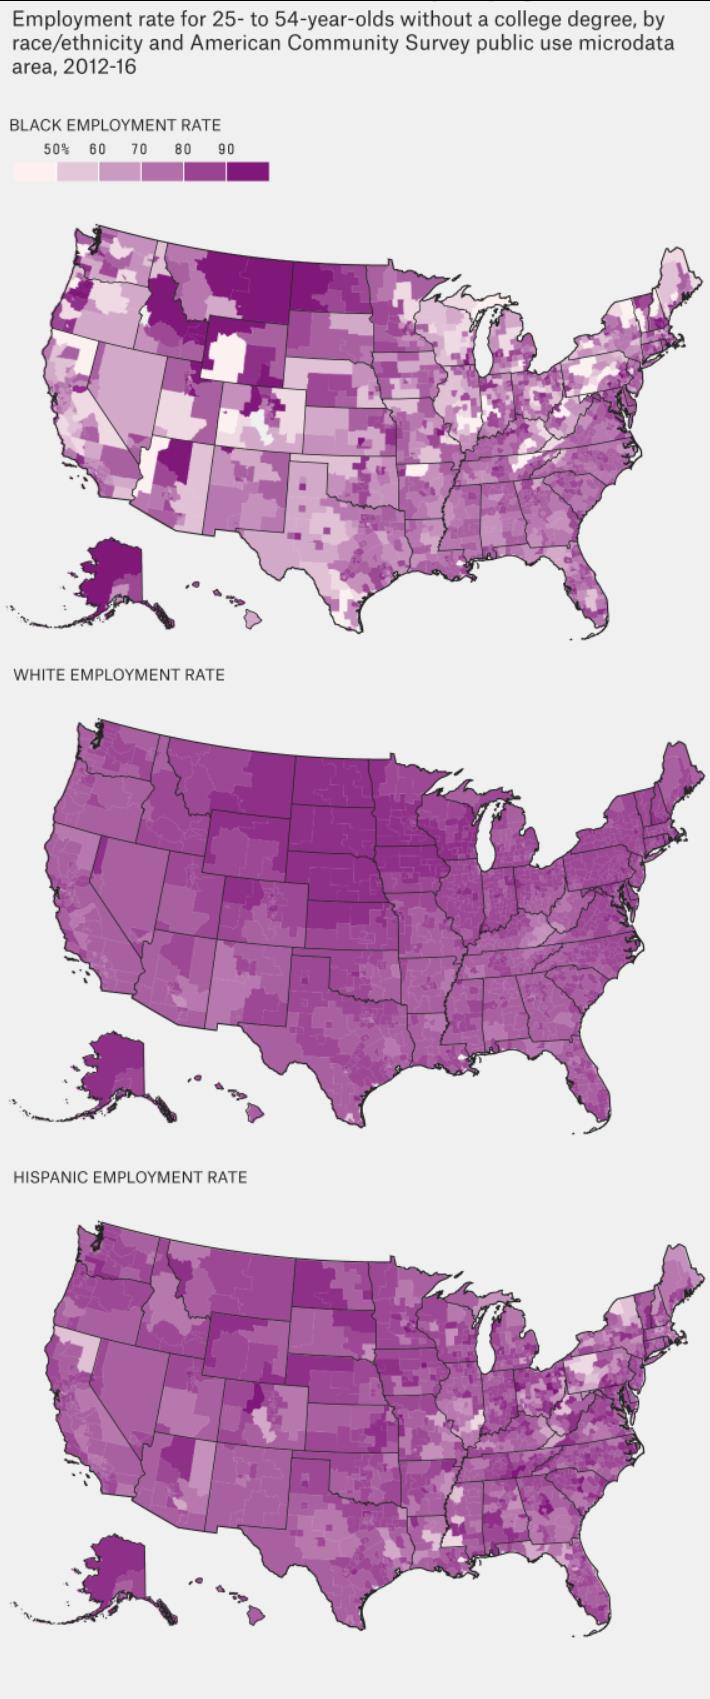
The “blue collar” black employment rate, among blacks without a college degree, is highest in the South.
Race and Housing
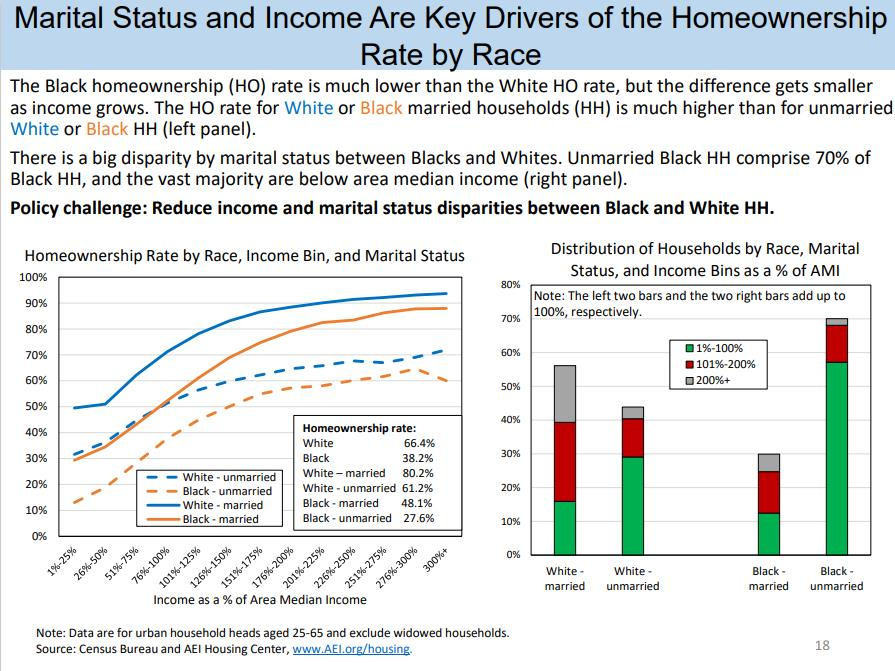
While some have attributed the devaluation of assets in black neighborhoods to racism, a closer evaluation by researchers at the American Enterprise Institute has shown
There can be no devaluation due to racial bias in this sample, but we found a substantial value difference, due to omitted socio-economic status (SES) factors such as income and credit score … [W]e confirmed this by using 6 variables that proxy for aspects of SES, and found valuation differences that ranged from 14% to 64%, including one that was larger and two much larger than the 23% devaluation the authors found when comparing tracts with Black shares of 50% and 0%. We conclude that what the authors characterize as race-based differences in home values are actually due, in large part, to SES differences.
Researchers at the American Enterprise Institute have also found that:
The Markup/AP analysis “A Secret Bias Hidden in Mortgage-Approval Algorithms” alleges discrimination in mortgage lending based on its analysis of limited HMDA data, which finds higher decline rates for the protected classes. Since lenders are likely denying borrowers with weaker credit profiles, one would expect to find lower default rates for the protected classes. Since that is not the case, it must be – as Becker stipulated - that on aggregate, there cannot be any discrimination by the industry. Logically, the higher decline rates for the protected classes cannot be reconciled with higher risk-adjusted default rates for said classes. Thus the Markup/AP study fits in the larger context of recent “research” and anecdotes alleging discrimination without much evidence.
Researchers at the American Enterprise Institute also reported they “found and continue to assert that what Perry and Rothwell characterize as race-based differences in home values are, in large part, likely due to socio-economic status (SES) differences. Lower SES certainly reflects a legacy of past racism and lingering racial bias, leaving Blacks at a large income (and wealth) disadvantage relative to most Whites. Recognizing the importance of SES factors is key to fashioning appropriate public and private responses. For if largely SES based, the primary remedy would be policies that work to address the income and wealth gap [independent of race].”
Links to all essays in this series: Part 1; Part 2; Part 3; Part 4; Part 5; Part 6

