Data on Racism – Part 5
Attitudes on the need for government programs to counter racism, disparities among sub-groups in the black community, and hate crimes.
In this essay, we’ll explore data on attitudes on the need for government programs to counter racism and disparities among sub-groups in the black community.
Attitudes on the Need for Government Programs to Counter Racism
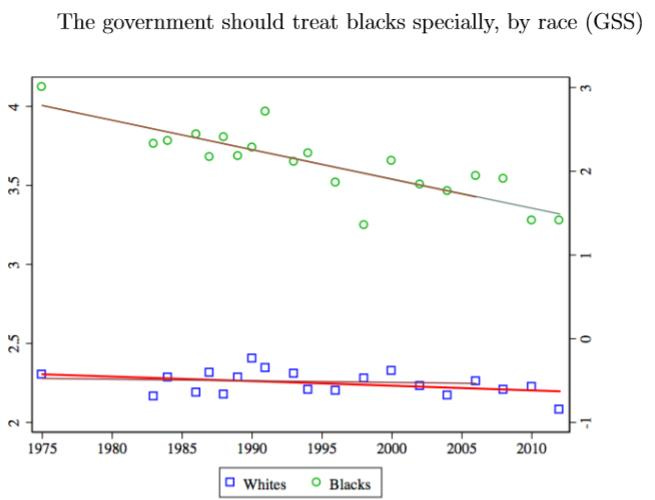
Over the last several decades, fewer blacks had come to believe the government should give special treatment to blacks.
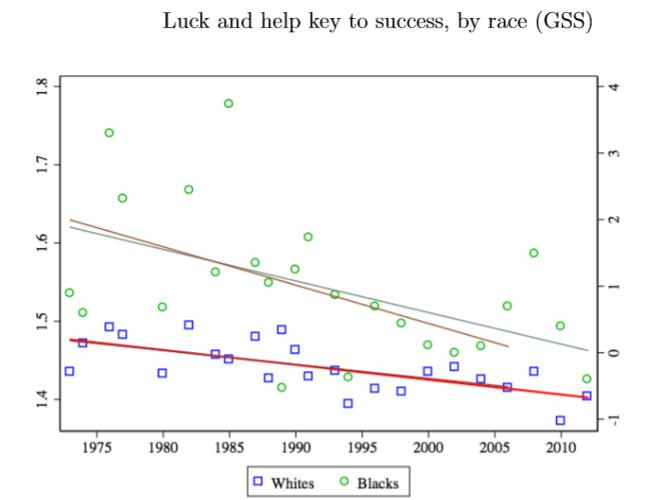
Over the last several decades, more blacks had also come to believe that hard work (and not luck or help from others) is the key to success.
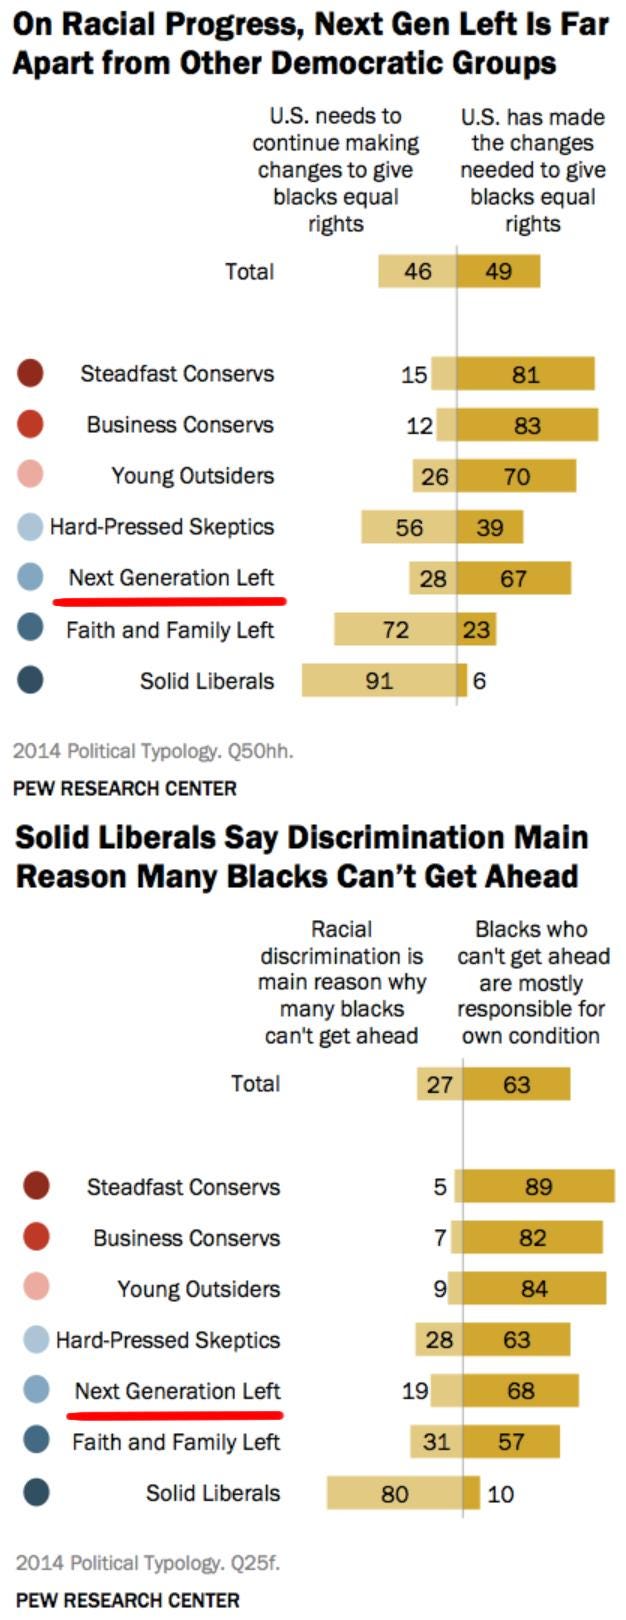
A large survey by the Pew Research Center in 2014 also found that large majorities of the “Next Generation Left” – that is, younger liberals – agreed that the U.S. has made the changes needed to give blacks equal rights, and that blacks who can’t get ahead are mostly responsible for their own condition.
Disparities Among Sub-Groups in the Black Community
Also, there are many differences in outcomes among sub-groups within the black community that indicate racism is not a significant factor as a general matter.
Using census data, IRS tax returns and other data, researchers Raj Chetty and Nathan Hendren examined how race affects economic mobility, defined as the ability to do better or worse than one’s parents. By and large they found that race is not determinative. The New York Times, which partnered with the researchers, reported that “the gap between Hispanics and whites is narrower, and their incomes will converge within a couple of generations if mobility stays the same. Asian-Americans earn more than whites raised at the same income level, or about the same when first-generation immigrants are excluded.” The study also found that black women “earn slightly more than white women” from comparable families. Black women also have higher college attendance rates than white men who come from comparable families.” Black boys fare worse than white boys, but one reason the racial gap in economic mobility for boys is so large is that so many black boys live in single-parent homes with one income and so many white boys live in two-parent homes with two incomes.
As John Butler points out in his book Entrepreneurship and Self-Help Among Black Americans: A Reconsideration of Race and Economics, Revised Edition: “When gender is considered, in 1959 black females earned about 61 percent as much per hour as white females. By 1979 they earned 98 percent as much. Thus, for women, the racial income gap almost closed completely.”
Black immigrants, especially Nigerians, also fare better than native blacks after college in terms of subsequent income. Nigerian Americans, for example, have dramatically higher incomes than black Americans and also Americans in general.
Joel Kotkin has pointed out that “Black immigrants from Africa and the Caribbean enjoy much higher rates of intact marriage and incomes than their African-American counterparts and are better educated than the average native born American.”
As this Bloomberg article points out:
Perhaps most surprising is that, by many measures, the most-educated immigrant group in the U.S. isn’t East Asians. It’s Africans. According to Census data, more than 43 percent of African immigrants hold a bachelor’s degree or higher -- slightly more than immigrants from East Asia. Nigerian immigrants are especially educated, with almost two-thirds holding college degrees -- a significantly higher percentage even than Chinese or South Korean immigrants. African immigrants are also very likely to hold advanced degrees, many of which are earned at U.S. universities. By many measures, African immigrants are as far ahead of American whites in the educational achievement as whites are ahead of African-Americans. That education translates into higher household income. Nigerian-Americans, for instance, have a median household income well above the American average, and above the average of many white and Asian groups, such as those of Dutch or Korean descent.
Hate Crimes
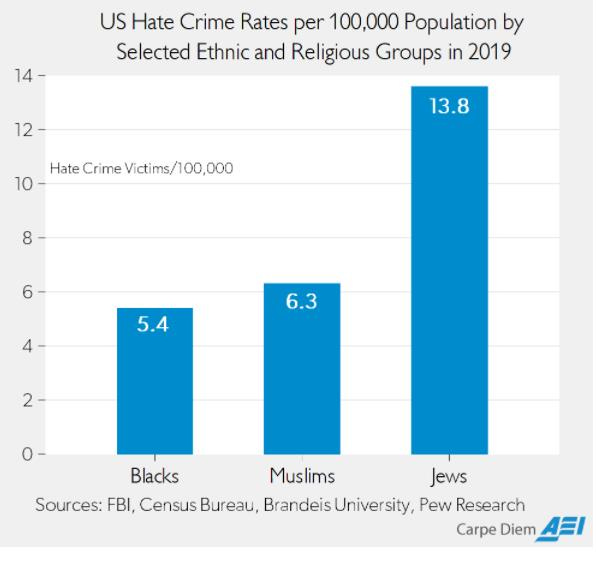
As Mark Perry reports, “Hate crime data released last November by the FBI for 2019 reveal that there were 2,391 black/African-American victims of hate crimes, 1,032 Jewish victims, and 227 Muslim victims. Adjusting for the population of each group in 2019 (43.98 million blacks, 7.5 million Jews, and 3.61 million Muslims) the hate crime victimization rates per 100,000 population of each group were 13.8 for Jews, 6.3 for Muslims, and 5.4 for blacks (see chart above). Therefore, adjusted for population by group, American Jews were 2.6 times more likely than blacks to be a victim of a hate crime in 2019, and 2.2 times more likely than a Muslim to be a hate crime victim.”
2019 statistics released by the FBI show that more than 7,100 hate crimes were committed in 2019. Of the 6,406 known offenders, 52.5 percent were white, 23.9 percent were black, 10 percent Hispanic. Other races and ethnicities accounted for the rest. Their crimes ranged from rape and murder to robbery and vandalism. But while one such crime is too many, the total number of hate crimes reported annually is small relative to the size of the U.S. population.
The next essay in this series will explore data on race and the American South, and housing and race.
Links to all essays in this series: Part 1; Part 2; Part 3; Part 4; Part 5; Part 6


