Data on Racism – Part 4
Data on racial pay gaps and some perverse outcome preferences based on perceptions of racism.
In this essay, we’ll look at data on racial pay gaps, and some perverse outcome preferences based on perceptions of racism.
Racial Pay Gaps
While some instances of discrimination continue to exist in the labor market, data show that current wage differentials between whites and blacks and Hispanics, and men and women, can be explained by differences in relevant employment factors. Wage differential ratios by race and gender are not statistically significant after controlling for schooling, scores on standardized tests like the Armed Forces Qualifications Test (AFQT), and work experience (and, in the case of gender, after controlling for other relevant factors including labor force withdrawal due to family responsibilities and marital status).
Racial disparities in pay also relate to what subjects students major in at college. Georgetown University’s Center on Education and the Workforce found that blacks tend to major in fields associated with lower-pay:
African Americans account for only 8 percent of general engineering majors, 7 percent of math majors ... only 5 percent of computer engineering majors [and] 7 percent of finance and marketing majors. In health majors, they account for 10 percent but clustered in the lowest-earning detailed major: 21 percent are in health and medical administrative services, compared to only 6 percent in the higher-earning detailed major of pharmacy, pharmaceutical science, and administration. African Americans are also highly represented in majors associated with serving the community which tend to be low earning -- human services and community organization (20%) and social work (19%) ... [Even worse,] since 2009 ... the percentage of African Americans with industrial and ... engineering technologies majors decreased by 4 percentage points and 3 percentage points, respectively. [The representation in majors for lower-paying jobs] saw a slight increase ... by 3 percentage points.
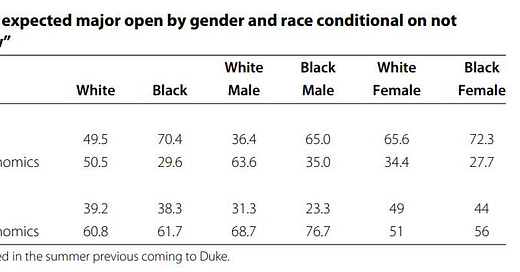
A 2012 study by Duke University researchers found that more than 76 per cent of black freshmen at Duke intended to major in the hard sciences or economics, but more than half of them switched track during the course of their studies, compared with just 8 per cent of white students such that that, by their senior year, only 35 per cent of black males graduated with a degree in science or economics.
As Heather MacDonald has explained:
The real reason that science labs aren't proportionally diverse isn’t bias. It is the academic skills gap. Blacks make up just over 1% of all SAT test takers who score between 700 and 800 on the math SAT, but 24% of all math SAT test takers with scores between 300 and 390. The average black math SAT score (454 in 2020) is more than a standard deviation below the average Asian math SAT score and nearly a standard deviation below the average white math score. Given that gap, it is unrealistic to expect proportional racial representation in STEM. The sexes don't differ much on average math scores, but the variance grows at the high end of math ability. The proportion of male test-takers with perfect or near-perfect SAT math scores is twice as large as the proportion of female ones.
MacDonald wrote more extensively on the topic in the City Journal, writing that:
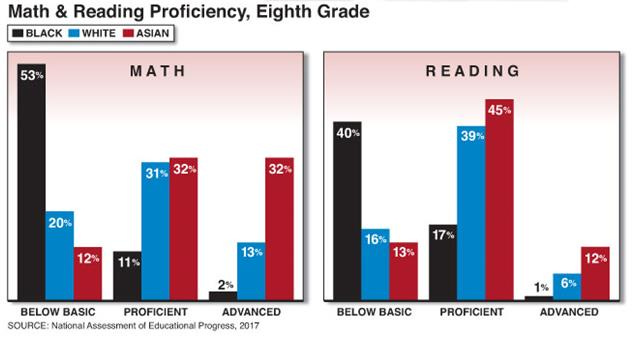
the expectation of proportional representation in every profession is groundless, thanks to the academic skills gap. The unequal distribution of skills, not bias, explains the lack of racial proportionality in employment. The median black eighth-grader does not possess even basic math skills. “Basic” skills, as defined by the National Assessment of Education Progress exam, means partial mastery of grade-related knowledge. Fifty-three percent of black eighth-graders scored “below basic” on math in 2017. Only 11 percent of black eighth-graders were proficient in math, and 2 percent were advanced. By contrast, 20 percent of white eighth-graders were below basic in 2017, 31 percent were proficient, and 13 percent were advanced. Only 12 percent of Asian eighth-graders were below basic, 32 percent were proficient, and 32 percent were advanced. The picture was not much better in reading. Forty percent of black eighth-graders were below basic in reading in 2017, 17 percent were proficient readers, and 1 percent were advanced readers. Sixteen percent of white eighth-graders were below basic in reading, 39 percent of white eighth-graders were proficient readers, and 6 percent were advanced readers. Thirteen percent of Asian eighth-graders were below basic, 45 percent were proficient, and 12 percent were advanced readers.
Black students never catch up to their white and Asian peers. There aren’t many white-collar professions where possessing partial mastery of basic reading and math will qualify one for employment … In 2005, the Journal of Blacks in Education estimated that there were only 244 black students in the U.S. with a math SAT above 750. Brookings used an estimation procedure that maximized the number of high-scoring black students and came up with, at most, 1,000 blacks nationwide with scores of 750 and above. Whether the number is 250 or 1,000, it means that the STEM fields, medical research, and the ever-more mathematical world of finance cannot all have a 13 percent black participation rate, at least if meritocratic standards remain in place … [T]here are simply not enough black STEM Ph.D.s to go around. In 2017, blacks made up 1.2 percent of all doctorates awarded in physics to U.S. citizens and permanent residents, according to the annual Survey of Earned Doctorates from the National Center for Science and Engineering Statistics. Blacks earned 0.9 percent of all mathematics and statistics doctorates, 1 percent of all doctorates in computer science, 2 percent of all doctorates in chemistry, and 1.7 percent of all doctorates awarded in engineering disciplines. There were no black Ph.D. graduates in medical physics, atmospheric physics, chemical and physical oceanography, plasma/high-temperature physics, logic, number theory, robotics, or structural engineering …
The Law School Admission Test is similarly skewed. The gap between white and black scores on the LSAT in 2013 was a 1.06 standard deviation. In 2004, only 29 blacks, representing 0.3 percent of all black LSAT takers, scored 170 or above on the LSAT, according to the Journal of Blacks in Higher Education. The average entrance score was 170 for the top-ranked law schools. There were 1,900 whites who scored at least a 170, representing 3.1 percent of all white test takers. Of black test takers, 1 percent—or 108 blacks nationwide—scored at least 165 in 2004, 165 being the average for the top ten law schools. Over 10 percent of white test takers—or 6,689 whites nationwide—scored at least 165. That gap has only grown, and it affects law school outcomes. Of black law school graduates, 22 percent never pass the bar exam after five tries, compared with 3 percent of white test takers, according to a study by the Law School Admissions Council. The skills measured by the LSAT and the bar exam—verbal reasoning, command of English, logical thinking—are required for a range of professions, whether corporate management and consulting, banking, or journalism … The mean black score on the business school admissions test (GMAT) in 2017 was 453, on an 800-point scale. The average for whites was 565, for Asians 586, and the overall average was 549. Only 15 percent of black test takers scored 600 or higher in 2017, compared with 45 percent of whites and Asians. Sixty-six percent of black GMAT takers scored less than 500. In 2018, students entering the top ten business schools, as ranked by The Economist, had average GMATs ranging from 690 to 732. The Journal of Blacks in Education estimated in 2006 that only 1 percent to 2 percent of black GMAT takers scored above 700, a proportion that has not likely changed. A former Harvard Business School professor told the Wall Street Journal in June that he had quit to protest the school’s systemic “antiblack practices.” An expectation of high-level quantitative skills was likely among those antiblack practices. Far from discriminating against blacks, the Harvard Business School admits at least twice as many black applicants as their average GMAT scores would predict … Medical schools have instituted large racial preferences because blacks’ Medical College Admission Test (MCAT) scores would otherwise make a “critical mass” of black students unattainable. As with the math SAT curve, black MCAT scores cluster at the bottom-left tail of the distribution. With each higher tranche of scores, the black percentage drops to low single digits. Between 2013 and 2015, about 53 percent of black MCAT takers scored 23 or lower, corresponding to 496 and below on the new MCAT scale. A 23 (or 496) is the 34th percentile and would be disqualifying for whites and Asians. The Princeton Review recommends a score at least in the 80th percentile for medical school applicants. Blacks in the next, still very low, tranche of MCAT scores and with low GPAs are admitted to medical school at nearly ten times the rate of similarly situated Asians and at seven times the rate of similarly situated whites. Over 56 percent of blacks with low MCATs and low GPAs are admitted to medical school, even though such scores predict failure on the U.S. Medical Licensing Examination Step 1. Less than 6 percent of Asians and 8 percent of whites are admitted under similar circumstances. Race plays so large a role in medical school admissions that a free online calculator of acceptance likelihood uses only three variables: GPA, MCAT score, and race …
Perverse Outcome Preferences Based on Perceptions of Racism
A 2019 Rasmussen survey found that 32 percent of Democrats responded yes to the question “Is it racist for a white politician to criticize the political views of a politician of color?”
Researchers have also conducted the following experiment, with the following results:
College students and community respondents were presented with variations on a traditional moral scenario that asked whether it was permissible to sacrifice one innocent man in order to save a greater number of people. Political liberals, but not relatively more conservative participants, were more likely to endorse consequentialism when the victim had a stereotypically White American name [Chip Ellsworth III] than when the victim had a stereotypically Black American name [Tyrone Payton].
Researchers have found that
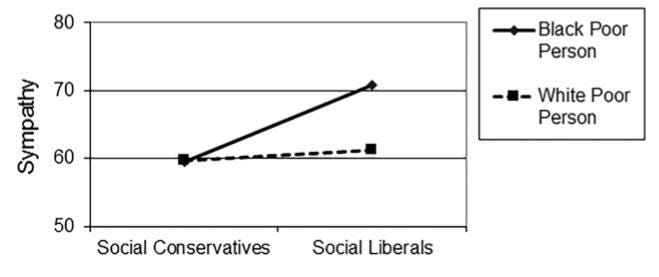
White privilege lessons are sometimes used to increase awareness of racism. However, little research has investigated the consequences of these lessons. Across 2 studies, we hypothesized that White privilege lessons may both highlight structural privilege based on race, and simultaneously decrease sympathy for other challenges some White people endure (e.g., poverty)—especially among social liberals who may be particularly receptive to structural explanations of inequality. Indeed, both studies revealed that while social liberals were overall more sympathetic to poor people than social conservatives, reading about White privilege decreased their sympathy for a poor White (vs. Black) person. Moreover, these shifts in sympathy were associated with greater punishment/blame and fewer external attributions for a poor White person’s plight.
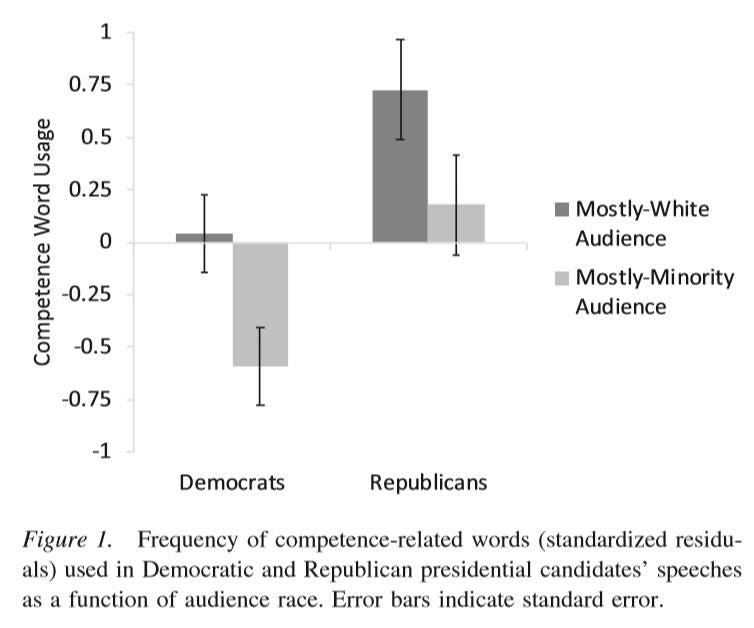
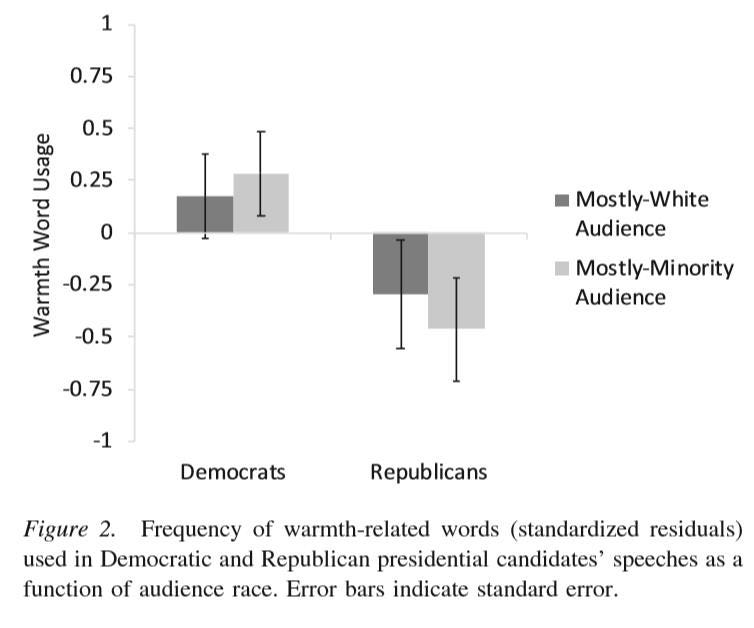
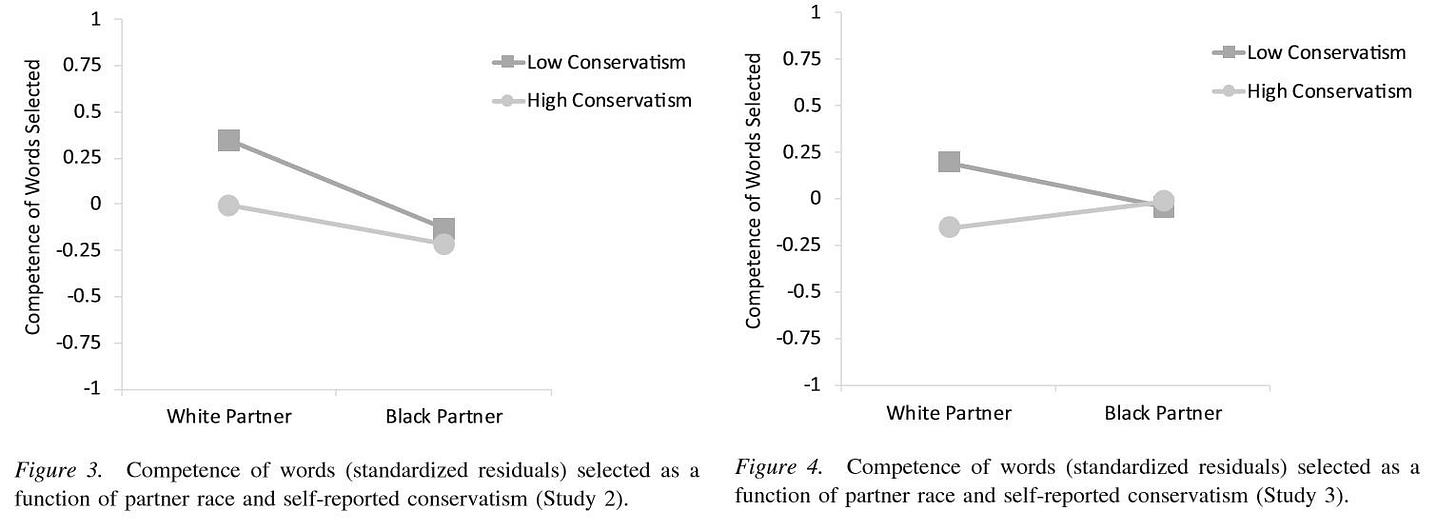
Some research shows that white liberals, including white liberal politicians, tone down their vocabulary to emphasize “warmth” over “competence.” Similar results were not found with white conservatives, including conservative politicians. As the study concluded:
Internal meta-analyses revealed that liberals—but not conservatives—presented less competence to Black interaction partners than to White ones. The simple effect was small but significant across studies, and most reliable for the self-reported measure of conservatism. This possibly unintentional but ultimately patronizing competence-downshift suggests that well-intentioned liberal Whites may draw on low-status/competence stereotypes to affiliate with minorities.
Race and Political Candidates
As Zaid Jilani writes:
University of Oxford researcher Sanne van Oosten … recently published research looking into how voters think about female and minority candidates. Her research was based on what’s called a meta-analysis — meaning that her team collected dozens of studies and looked at what they collectively found. Collectively, they looked at over 40 studies, seeking to figure out what voters thought about a candidate based off their first impressions. Do female and minority candidates suffer a penalty from voters compared to white or male politicians? Her conclusion from the studies — most of which took part in the American context — was optimistic. Voters don’t penalize female and minority candidates … “Voters aren’t negative — in some cases [are] even positive about women, about Asian candidates, and think the same about black candidates as they do about white candidates. It’s actually quite positive,” she told me in an interview.
The next essay in this series will explore data on attitudes on the need for government programs to counter racism, disparities among sub-groups in the black community, and hate crimes.
Links to all essays in this series: Part 1; Part 2; Part 3; Part 4; Part 5; Part 6

