The Diminishing American Labor Force – Part 1
Well before COVID-19, increasingly fewer Americans were working.
In previous essays I’ve explored the consequences of lower birth rates in America and the ramifications of their being fewer American young people in the future moving through the workforce ranks. But now let’s focus on those younger people who are currently of working age, living in what would potentially be their most productive working years, but who are not working.
This essay will focus on the situation as it existed before the COVID-19 pandemic and examine the baseline trends that were present even before the dramatic effects of the pandemic on workforce participation (and federal spending).
The labor force participation rate is the percentage of the population that is either working or actively looking for work. Even before the COVID-19 pandemic, the labor force participation rate among younger people was looking increasingly worse, and that trend was independent of larger economic conditions, continuing through periods of both high and low employment.
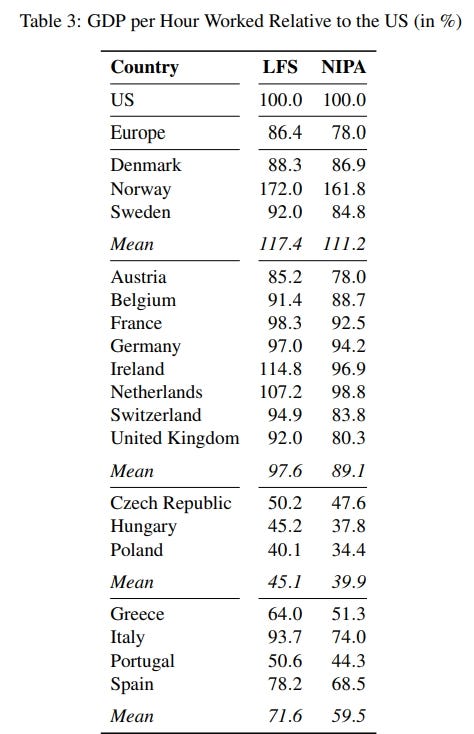
Americans with jobs work longer than their European counterparts. One study found that the average person in Europe works 19 percent less than the average person in the U.S., which amounts to about 258 fewer hours per year, or about an hour less each weekday, meaning U.S. workers put in almost 25 percent more hours than Europeans.
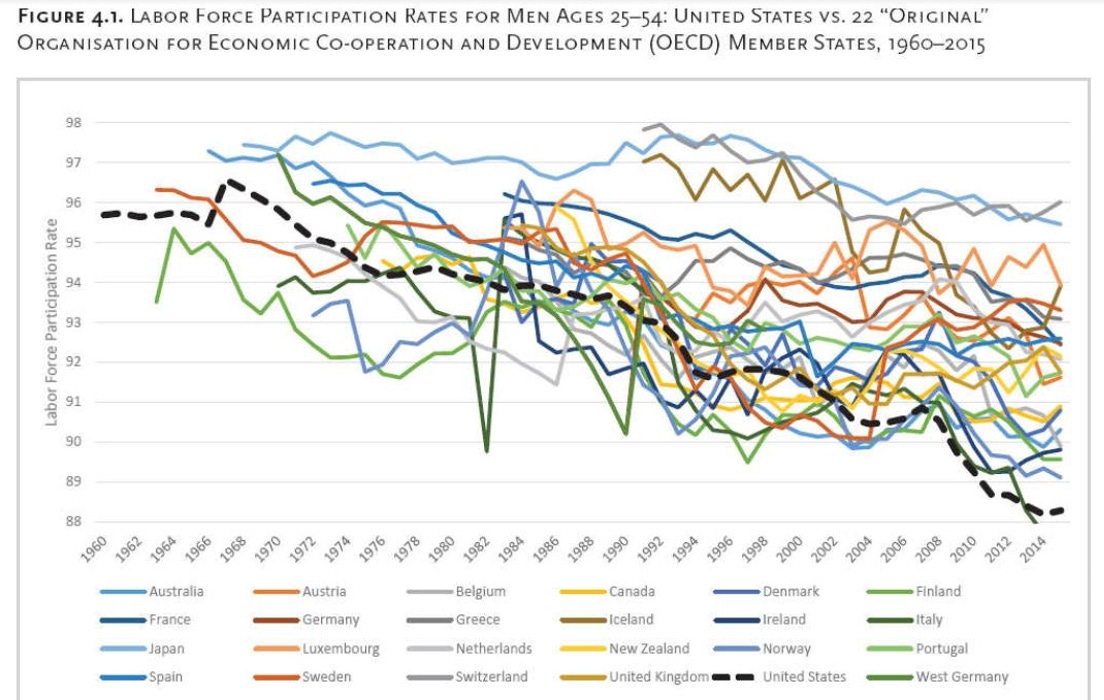
However, that extra work is being performed by an increasingly smaller percentage of the potential American workforce. Labor force participation ratios for men in their late 30’s are significantly lower in America than in Europe today. (The labor force participation rate was even much higher in Greece, which faced a sovereign debt crisis starting in 2009, for men in their late 30’s.)
The United States recently ranked twenty-second out of twenty-three Organization for Economic Co-operation and Development countries in prime-age male labor force participation, worse than all other countries except Italy.
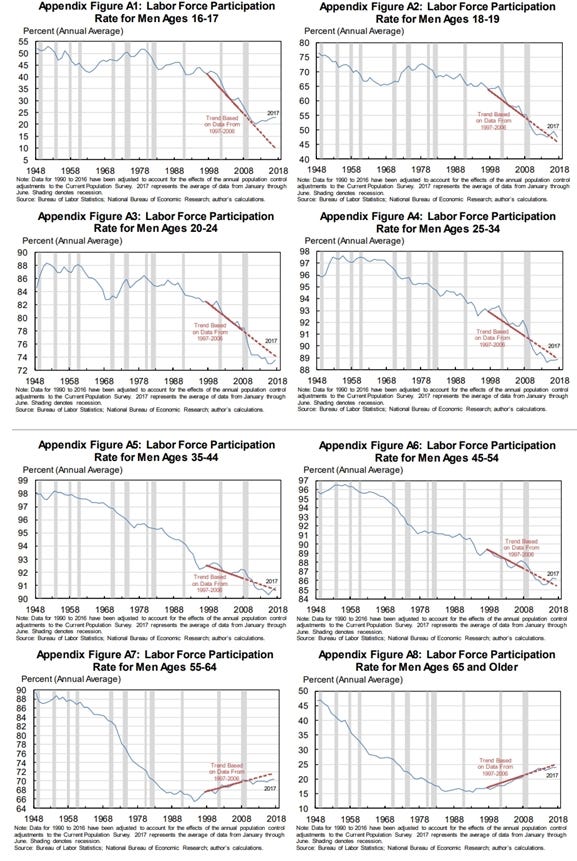
A paper prepared for the Boston Federal Reserve found the male labor force participation rate as of 2017, broken down by age group, to be as follows:
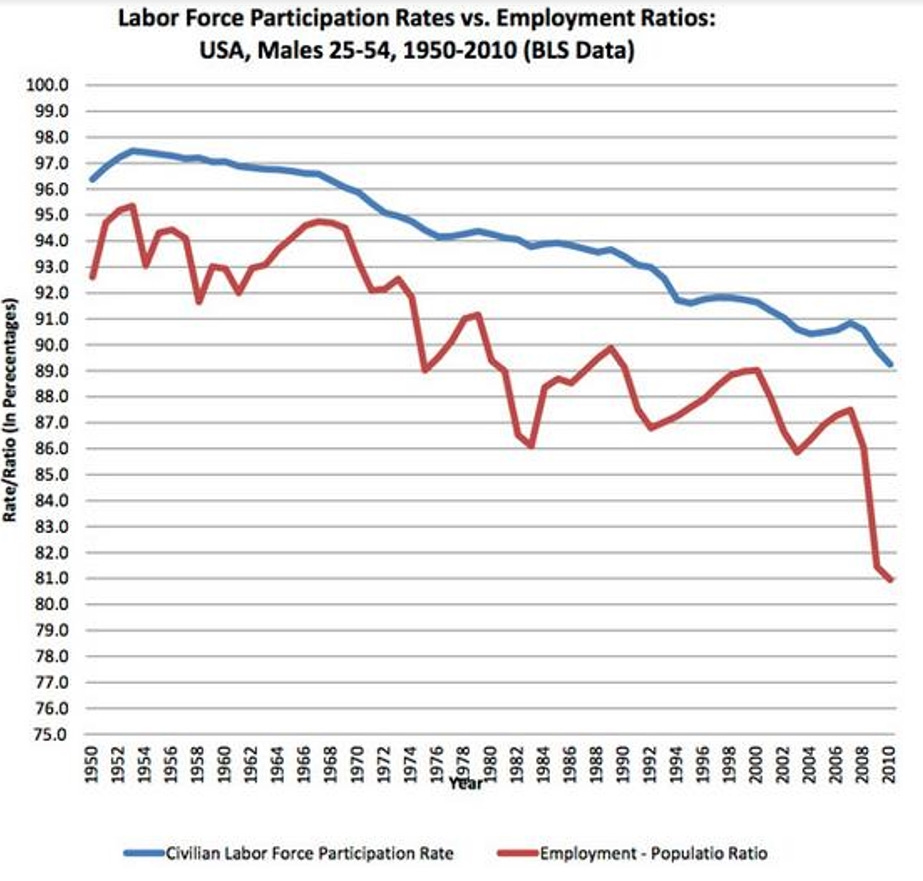
As Nicholas Eberstadt has pointed out, “Over the past 60 years, the employment ratio for adult men has plummeted by about 20 percentage points. Which is to say: if America’s male employment ratios were back to their Eisenhower-era levels, well over 20 million more men would be at work today.”
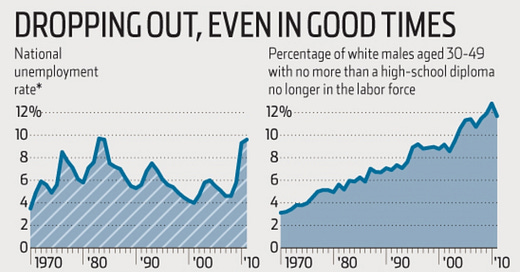
It’s worth noting that the crisis in the growing percentage of prime-age men who stopped looking for work isn’t reflected in the unemployment rate because the unemployment rate measures the share of workers in the labor force who don’t currently have a job but are actively looking for work. People who haven’t looked for work in the past four weeks are excluded from the unemployment rate.
As Zachary Karabell writes in The Leading Indicators: A Short History of the Numbers That Rule Our World:
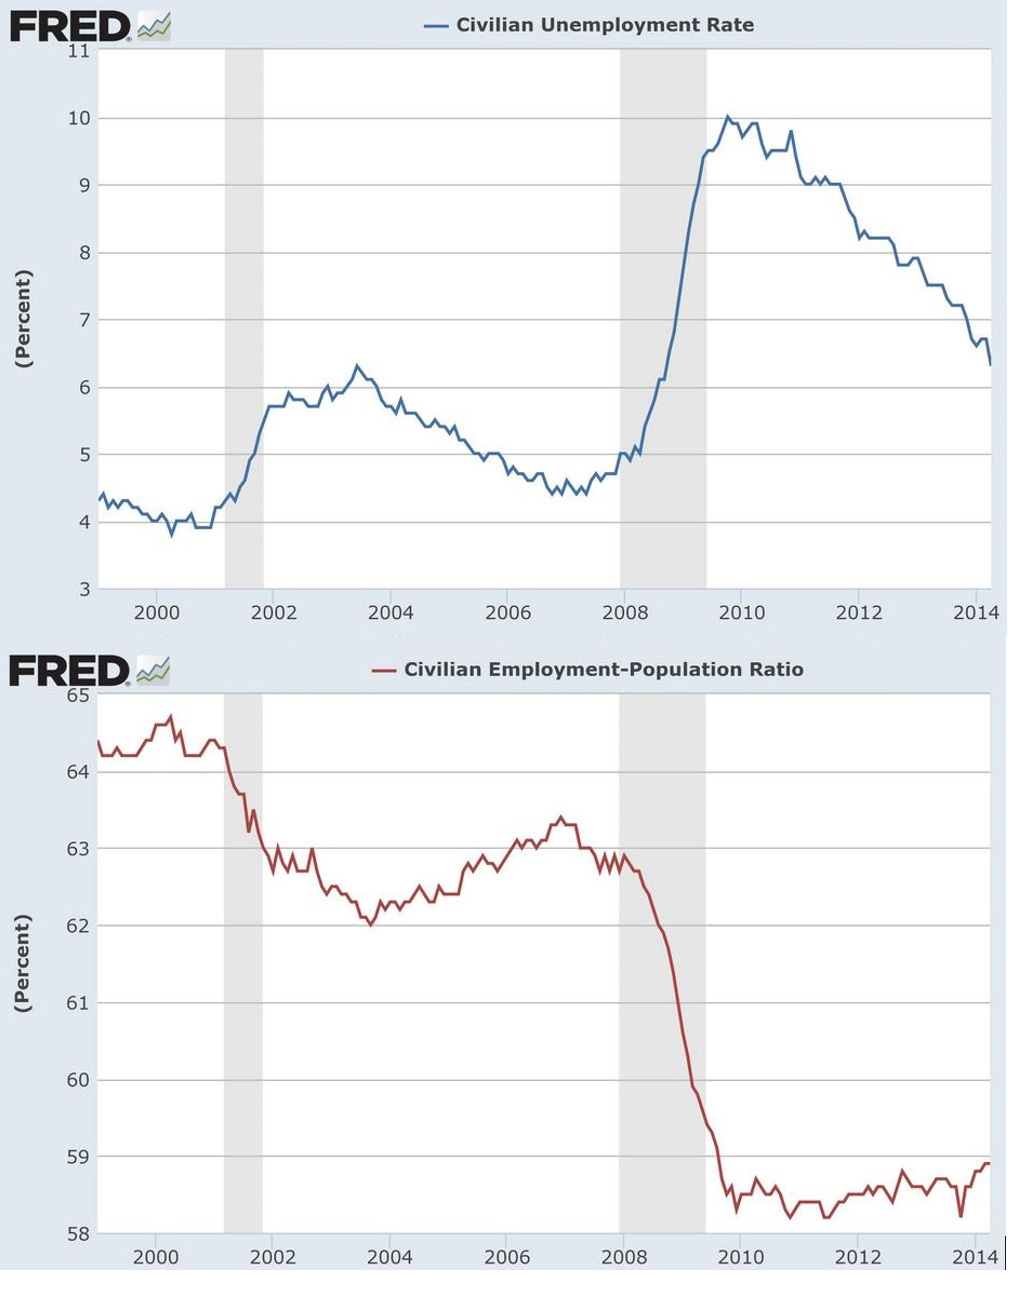
[T]here is nothing wrong per se with the unemployment figure, provided you know that the definition of employment is a construct, not a counting exercise. As we discussed earlier, to be unemployed, according to the Bureau of Labor Statistics, you have to be in the workforce. To be in the workforce, you have to have a job or be looking for a job. To be looking for a job, you have to answer when surveyed that you have actively sought employment at some point in the past four weeks. If you haven’t, you aren’t actually unemployed. You are a discouraged worker, are marginally attached to the workforce, and are not counted as part of said workforce. And if you haven’t been looking for a year, you’re not, statistically speaking, even discouraged. You simply, statistically speaking, don’t exist. You do, of course, actually exist (though that is a whole other topic), but not in the statistical universe of employment data … The result of such methods is that it is possible, and not just theoretically, for the unemployment rate to drop not because more jobs were created or more people were hired but simply because more people gave up looking for work and dropped out of the workforce. That is, in fact, what happened in the United States and swaths of Europe after 2009, though in America, there were also real job gains in 2010 and after. Nonetheless, the unemployment rate, which receives so much public scrutiny, went down in part not because the economic system was creating so many new jobs but because it was failing to do just that. To be fair, the BLS keeps multiple unemployment statistics and different unemployment rates, including ones that include underemployed, marginally attached, and part- time workers, but there is only one headline number. That is what the BLS points to in its monthly release; that is what the media pick up; and the other numbers are at best footnotes.
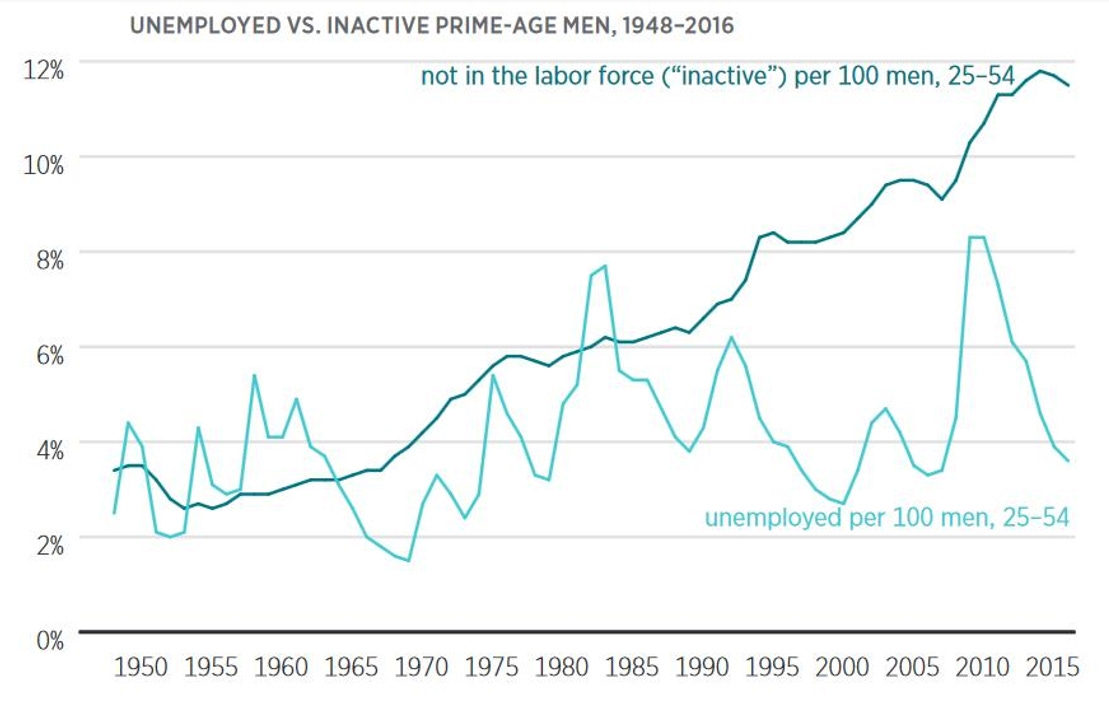
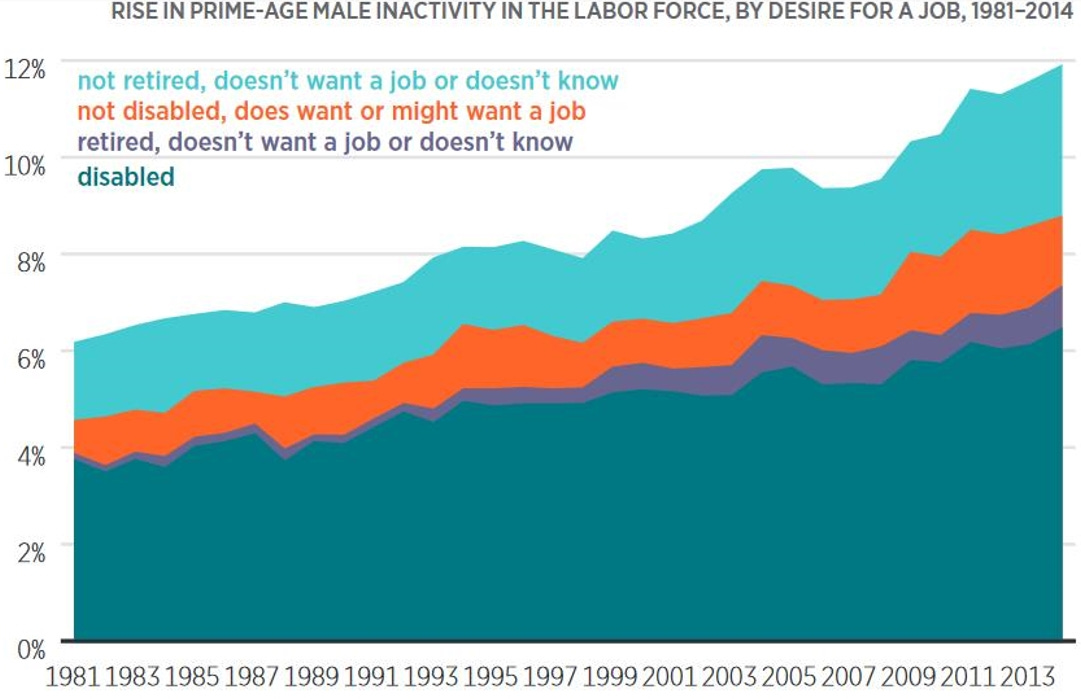
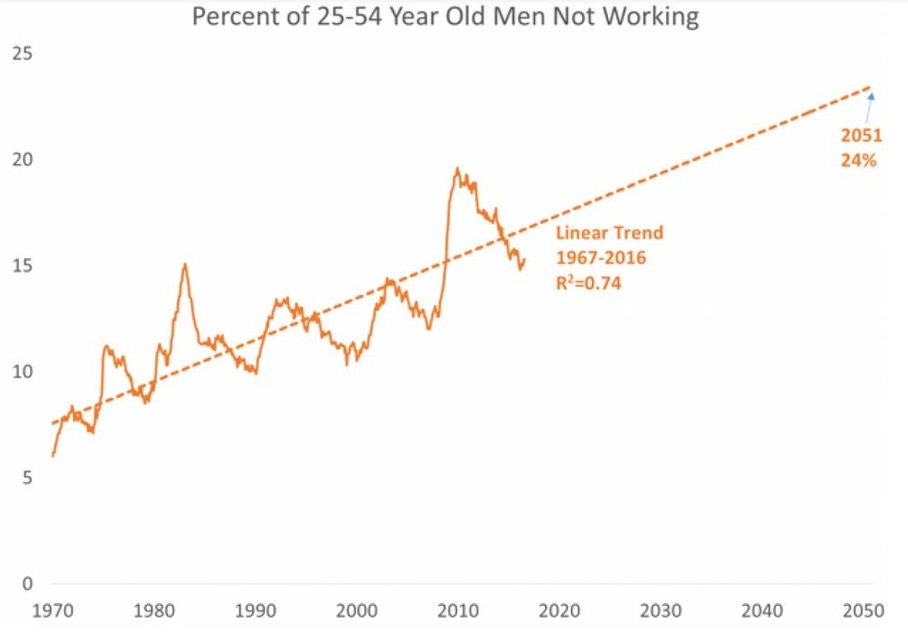
As Scott Winship writes, “In contrast to the unemployment trend, inactivity has risen steadily. The increase in inactivity among prime-age men began in 1956, and its pace accelerated after 1967, rising from 3.4 percent in that year to 11.5 percent in 2016. Since 1964, more prime-age men have been jobless and not looking for work than jobless and looking for work in every year except for 1982 and 1983.”
As Eberstadt has written, referring to the graphs below, “Simply put, there are no longer just two employment statuses in America. There are now three: (1) employed; (2) unemployed; and (3) choosing neither to work nor to look for it … We have seen a gradual and continuing improvement in reported unemployment since 2010, but for the past four years the work rate has essentially flat-lined. Our unemployment rate doesn't tell us anything about the work rate anymore.”
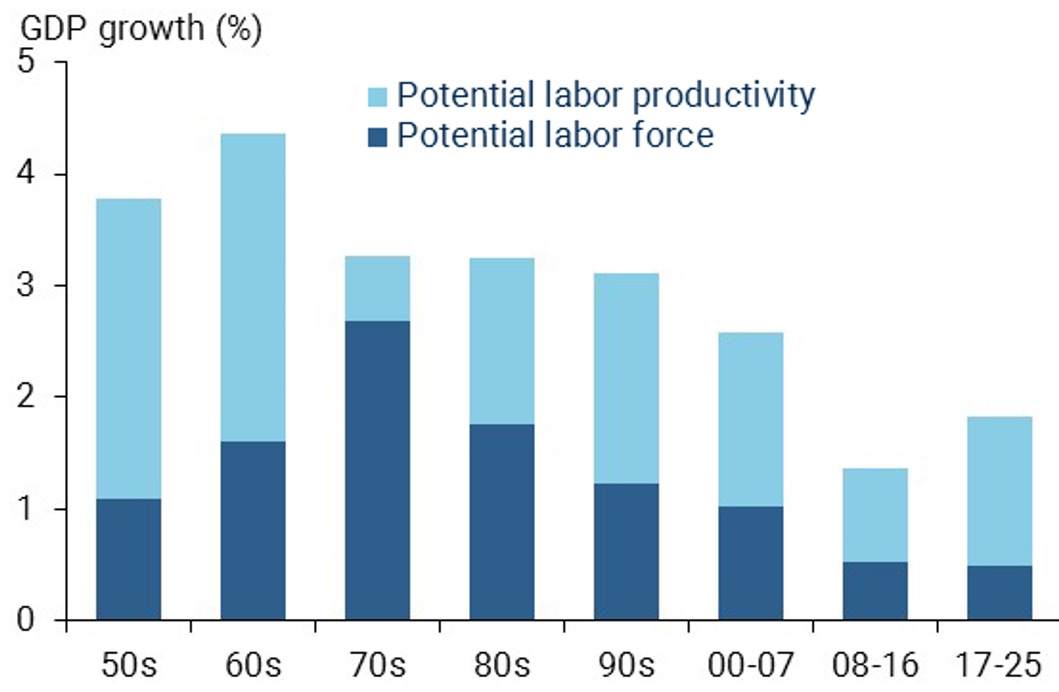
A San Francisco Federal Reserve analysis in 2018 noted the following:
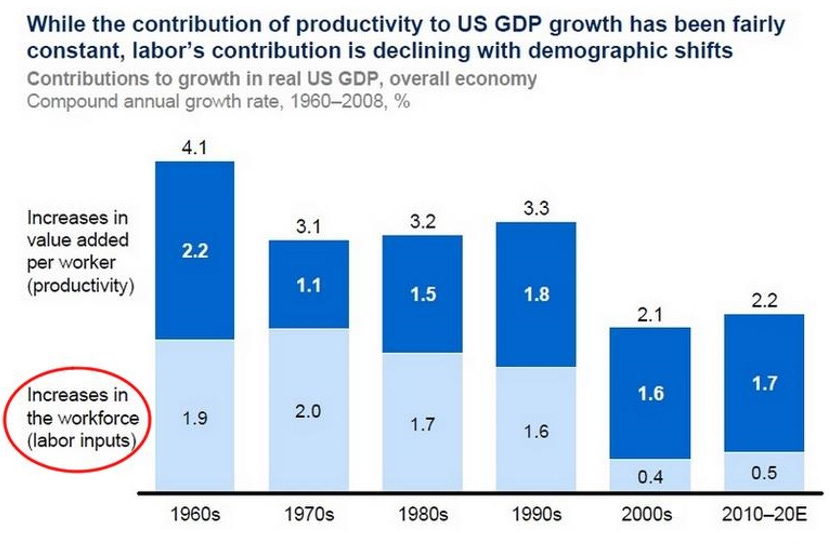
In the 1970s, labor force growth alone contributed 2.7 percentage points to GDP growth, meaning that even if productivity growth had been zero, the economy would have expanded at 2.7%, slightly faster than the pace of our current expansion. Since that peak, labor force growth has come down substantially. As the forecast for 2025 shows, labor force growth is expected to remain stuck at 0.5% for the next decade. This means that, absent a surge in productivity, slow growth in the labor force will be a restraining factor on the U.S. economic speed limit.
A growing percentage of prime-age men are not retired, don’t want a job, or don’t know if they want a job.
As Eberstadt pointed out in January, 2020:
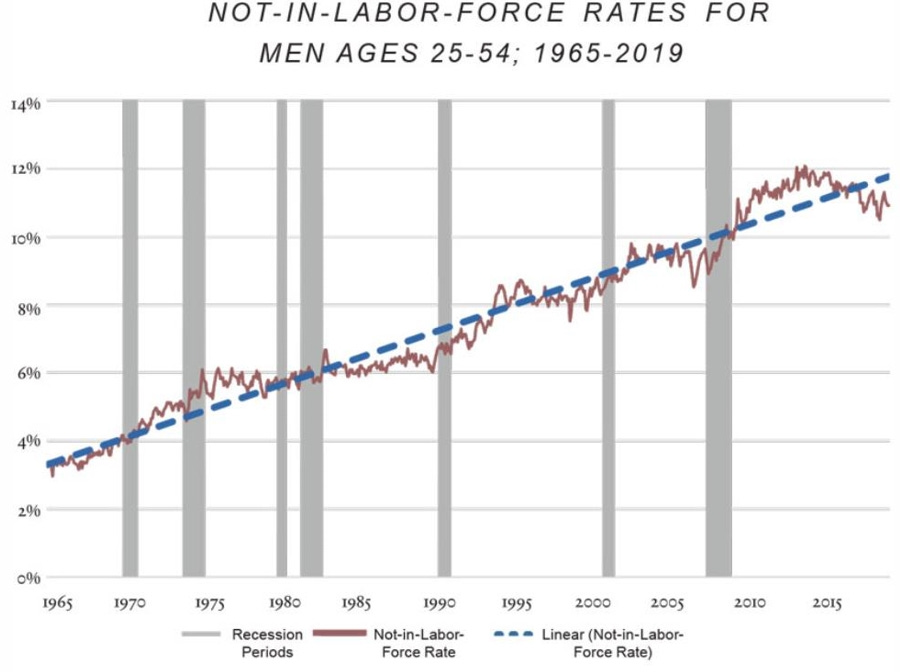
Only a tiny fraction of workless American men nowadays are actually looking for employment. Instead we have witnessed a mass exodus of men from the workforce altogether. At this writing, nearly 7 million civilian non-institutionalized men between the ages of 25 and 54 are neither working nor looking for work — over four times as many as are formally unemployed. Between 1965 and 2015, the percentage of prime-age U.S. men not in the labor force shot up from 3.3% to 11.7%. (The overall situation has slightly improved in the last four years, but this group still accounted for 10.8% of the prime-age male population in October 2019.) Over that half century, labor-force participation rates fell for prime-age men in all education groups, but the decline was much worse for men with lower levels of educational attainment than for those with higher levels. Labor-force participation dropped by about four percentage points for college graduates and by two points for men with graduate training; it fell by 14 points for those with no more than a high-school diploma, and by 16 points for those who didn't finish high school. By 2015, nearly one in six prime-age men with just a high-school degree was neither working nor looking for work, and for those without a high-school diploma, the ratio was worse than one in five … As may be seen in the figure below, U.S. prime-age male “inactivity rates” (or not-in-labor-force rates) have been rising at a remarkably steady tempo since the mid-1960s. This monthly exodus from the workforce has been so steady since 1965 that it almost traces a straight line.
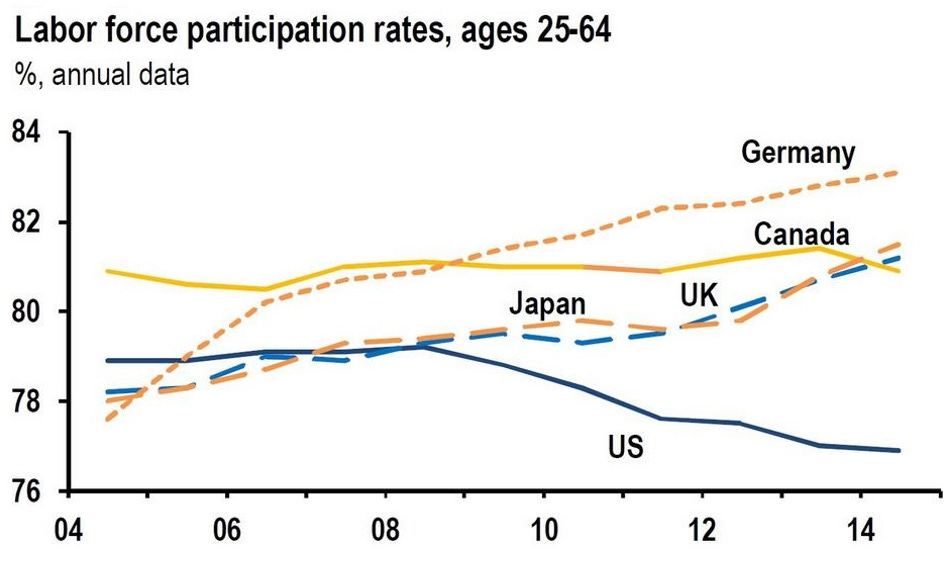
Eberstadt continues: “there is [also] America’s curiously poor prime-age male labor-force participation-rate performance in comparison with other affluent never-communist democracies. Between 1965 and 2015, U.S. levels fell faster and sank lower than in any comparable country, with the exception of Italy (where official employment figures notoriously neglect ‘unofficial’ work income).”
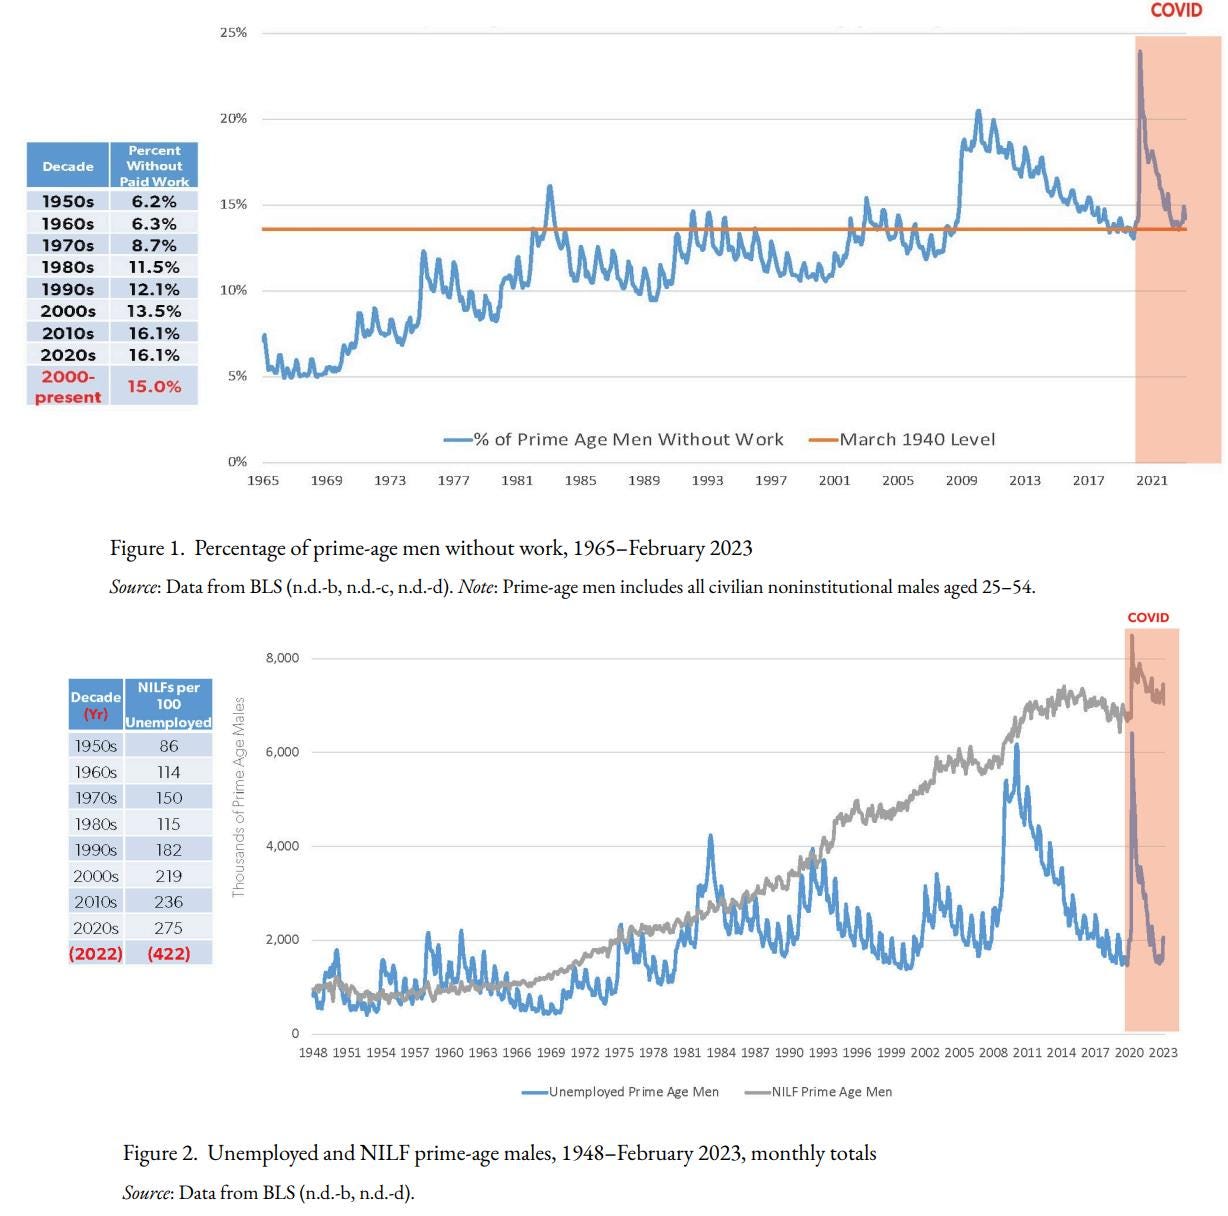
Eberstadt addresses updated figures in 2024, noting that
As may be seen in figure 1, over the entirety of the twenty-first century thus far, the mean monthly percentage of prime-age American men with no paid work has been over a percentage point higher than it was back in March 1940 when the national unemployment rate was almost 15 percent! Yes, twenty-first-century America has more income than ever before, more education than ever before, and more prosperity than ever before. And yet the average percentage of nonworking prime-age men in our country is higher than it was at the tail end of the Great Depression … The paradox of simultaneous low unemployment rates and low employment rates for the contemporary prime-age American male population is exhibited in figure 2, which compares trends in postwar-era monthly headcounts for prime-age men who are unemployed—out of a job and looking for work—and those who are NILF [not in the labor force] —neither working nor looking for work.
A larger percentage of inactive men in central cities don’t want a job, compared to rural areas.
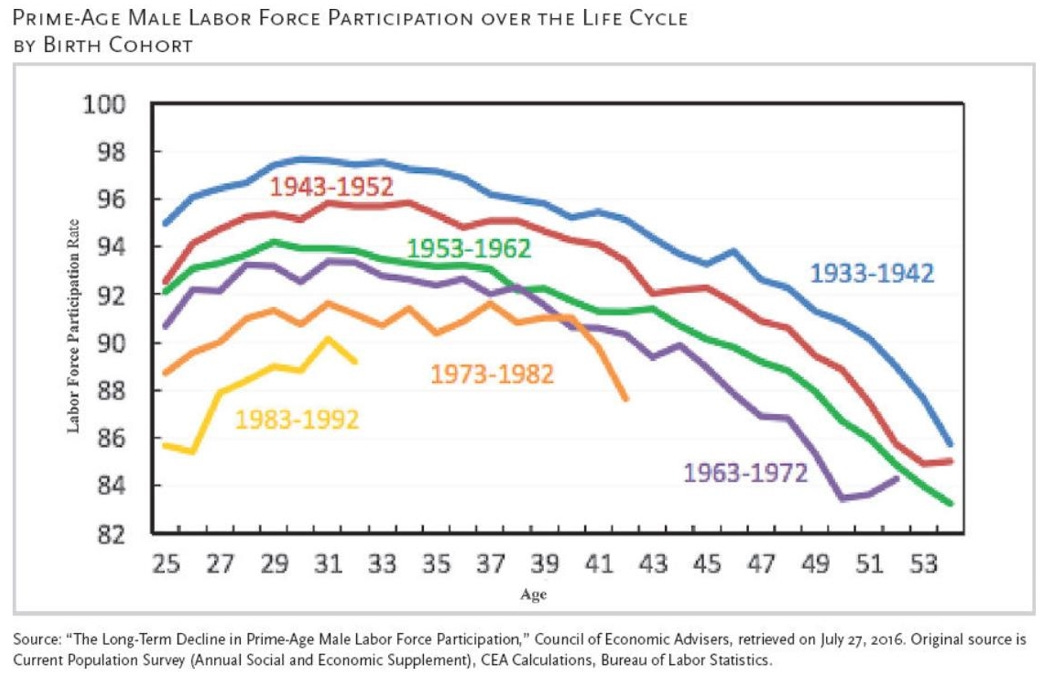
Compared to previous generations, younger generations have been less likely to join the labor force.
Future projections of the labor force participation rate from the Federal Reserve and by others, including Lawrence Summers, were bleak, but largely accurate, and they indicate that on its current trajectory about a quarter of all prime working-age men won’t be working.
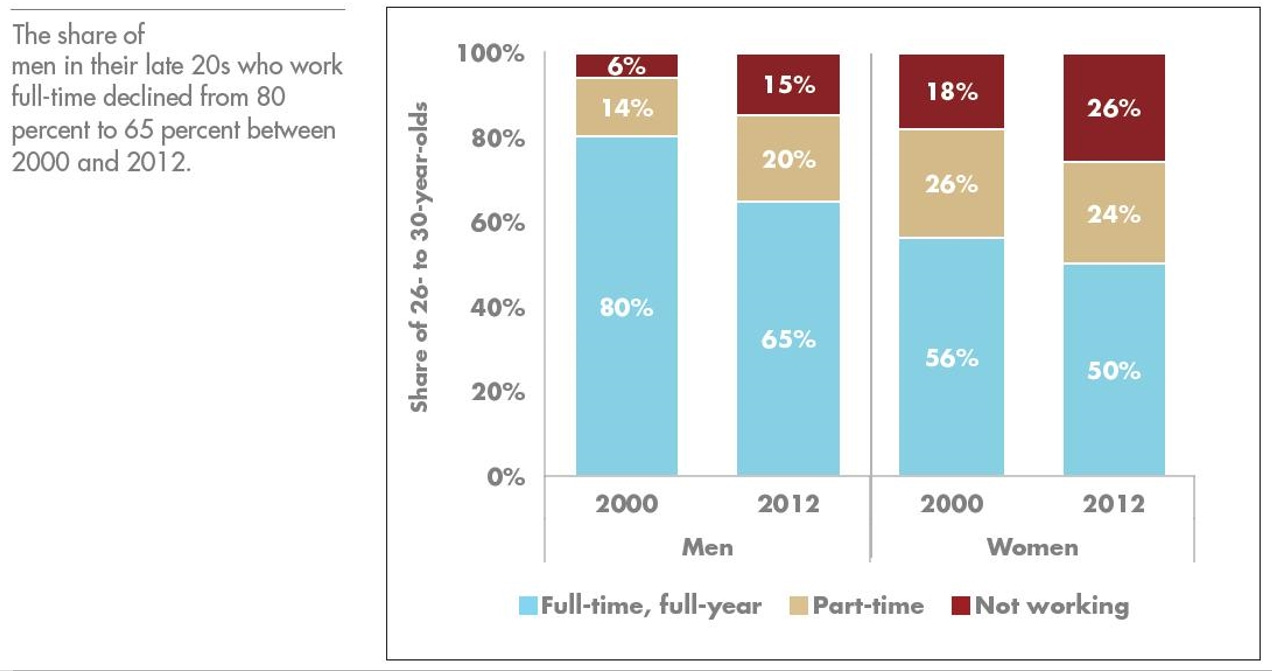
The share of men in their late 20’s who work full-time has also declined fifteen percent since 2000.
The decline in labor force participation is specific to the United States. Returning prime-age participation rates to levels that prevailed ten years ago would add at least 2% to GDP.
In the 1960’s, fast labor-force growth made it easier for the economy to grow. Today, slow labor-force growth limits the potential for economic growth going forward.
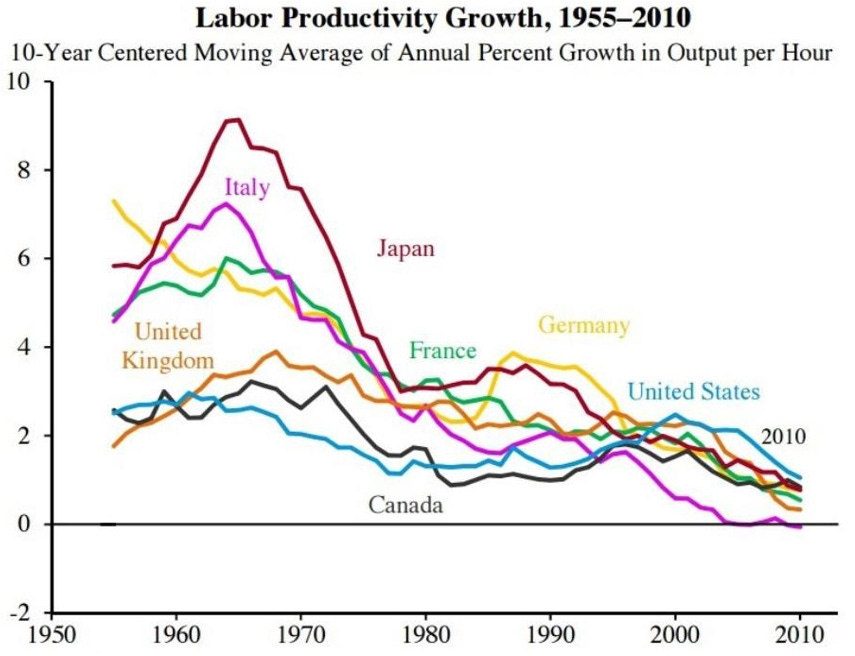
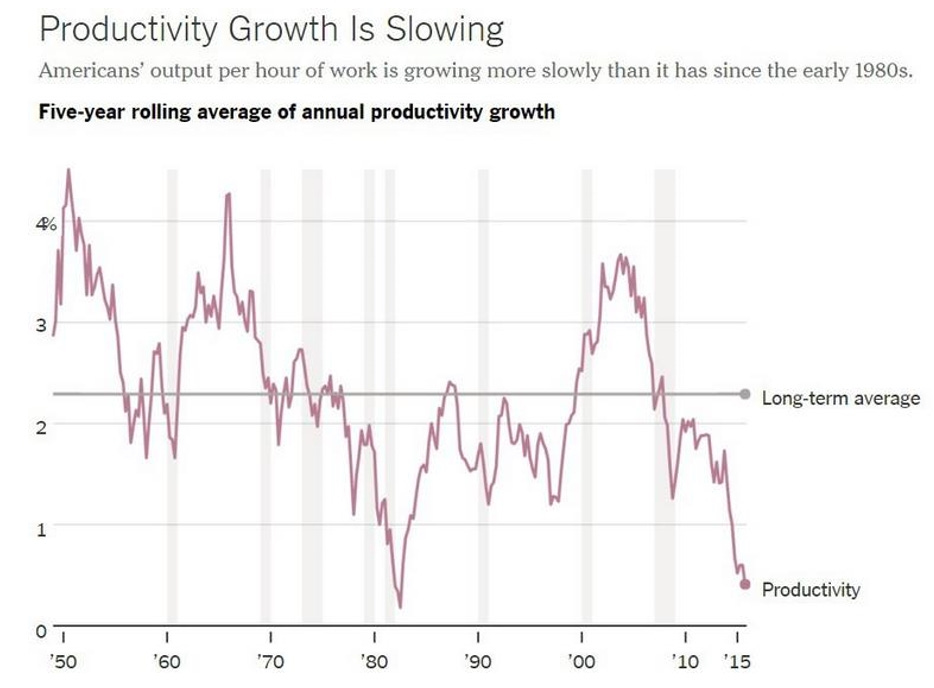
As the labor force participation rate has fallen over time, so has the productivity per worker in the labor force.
From 2011 through 2015, the government’s official labor productivity measure shows only 0.4 percent annual growth in output per hour of work. That’s the lowest for a five-year span since the 1977-to-1982 period, and far below the 2.3 percent average since the 1950’s.
What helps explain this dramatic decrease in the labor force participation rate, especially among younger people? That will be the subject of the next essay.
Links to all essays in this series: Part 1; Part 2; Part 3; Part 4; Part 5

