The Diminishing American Labor Force – Part 4
The COVID-19 pandemic and “stimulus” payments that massively increased the federal debt.
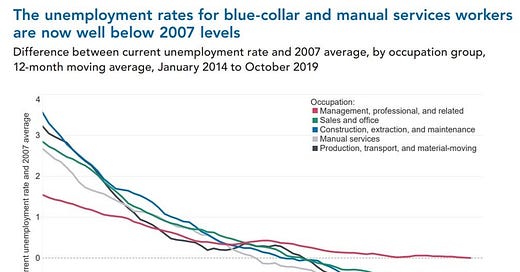
Following the enactment of the Tax Cuts and Jobs Act of 2017, the labor market had significantly improved. The Conference Board, a global business think tank known for regularly publishing labor market indicators, released a report in February, 2020, titled “US Labor Shortages: Challenges and Solutions.” The report states that in the span of just 10 years “the US economy moved from having the weakest labor market since the Great Depression to one of the tightest in history.” The result has been “critical shortages, especially for blue-collar and manual services employers who are experiencing much tighter labor markets than employers of highly educated white-collar workers -- the exact opposite of prevailing trends in recent decades.” The report states “demand for blue-collar and manual services workers is increasing,” creating labor shortages, and the result is unemployment rates for blue-collar and manual services workers are well below 2007 levels (before the last recession):
That report from early 2020 also found “large improvement in participation rates among black workers and young Hispanic women -- the same groups that have historically seen participation rates well below national averages.” Companies, especially in blue-collar industries, had also “increased their efforts to recruit underserved populations such as women, mature workers, the disabled, immigrants, and veterans.” The report states the “number one solution” companies use to recruit and retain employees is “raising wages and salaries.” As displayed below, wages are now growing fastest for the group that includes blue-collar and manual services workers:
But in 2020, the COVID-19 pandemic spread throughout the world and the federal government enacted massive new stimulus spending and entitlement programs in response. This essay and the next will consider how that response dramatically expanded the federal debt and further reduced labor force participation.
Federal Debt
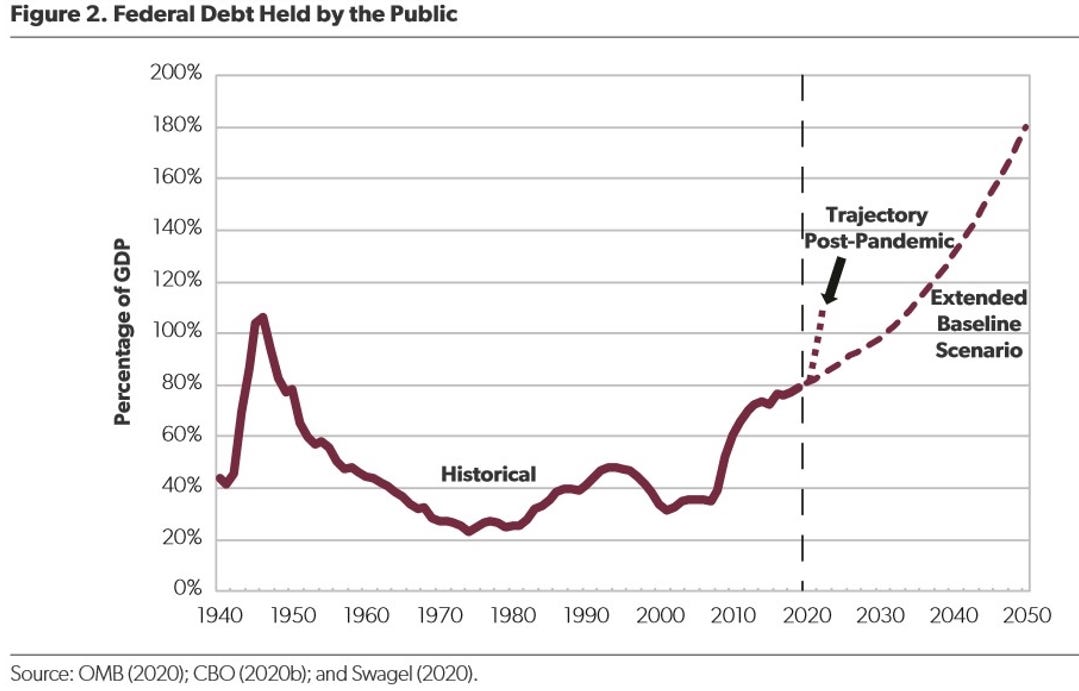
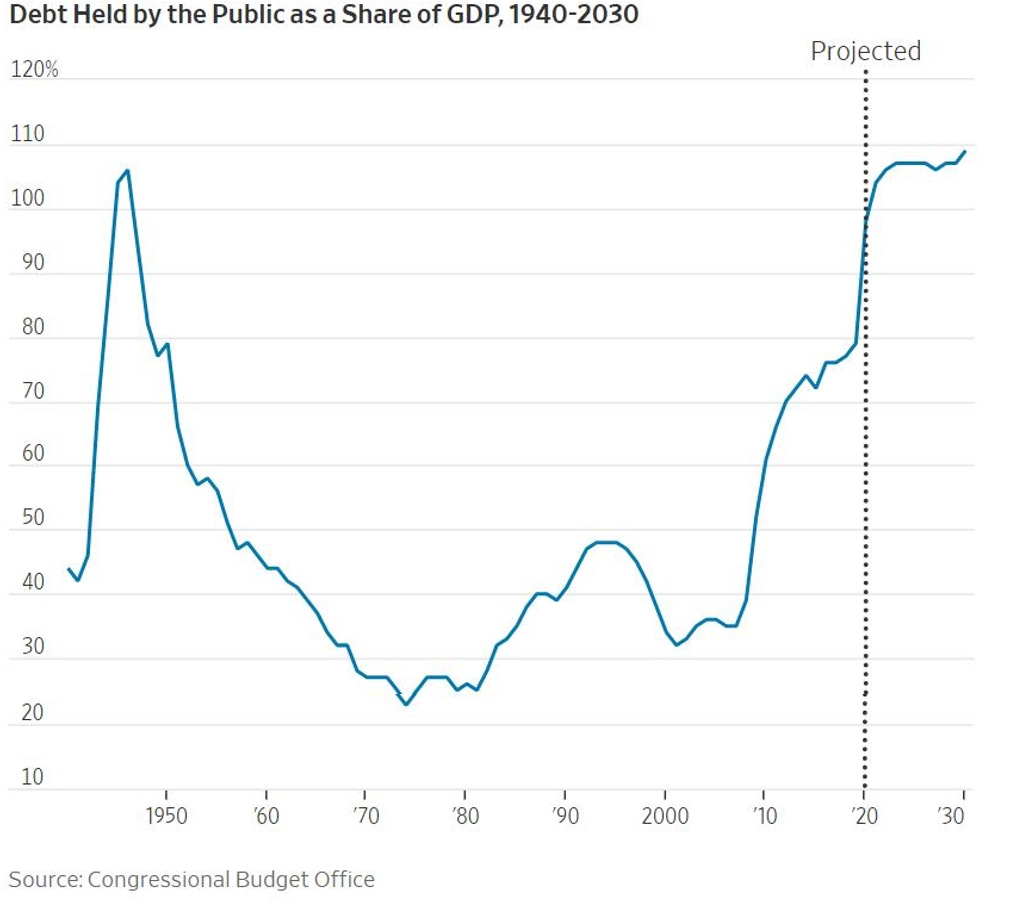
As James Capretta at the American Enterprise Institute points out: “The pandemic has made even this unfavorable projection look optimistic. CBO now expects federal debt to reach 101 percent of GDP in 2020 and then 108 percent of GDP in 2021, which is higher than it was at any time during and after World War II.”
The Wall Street Journal described the U.S. debt situation this way in February, 2021:
Which brings us to the federal debt, which has leapt into uncharted territory … How much debt is too much, and when does it begin to have corrosive economic consequences? No one knows, but one economic benchmark for harm has been 90% of GDP.
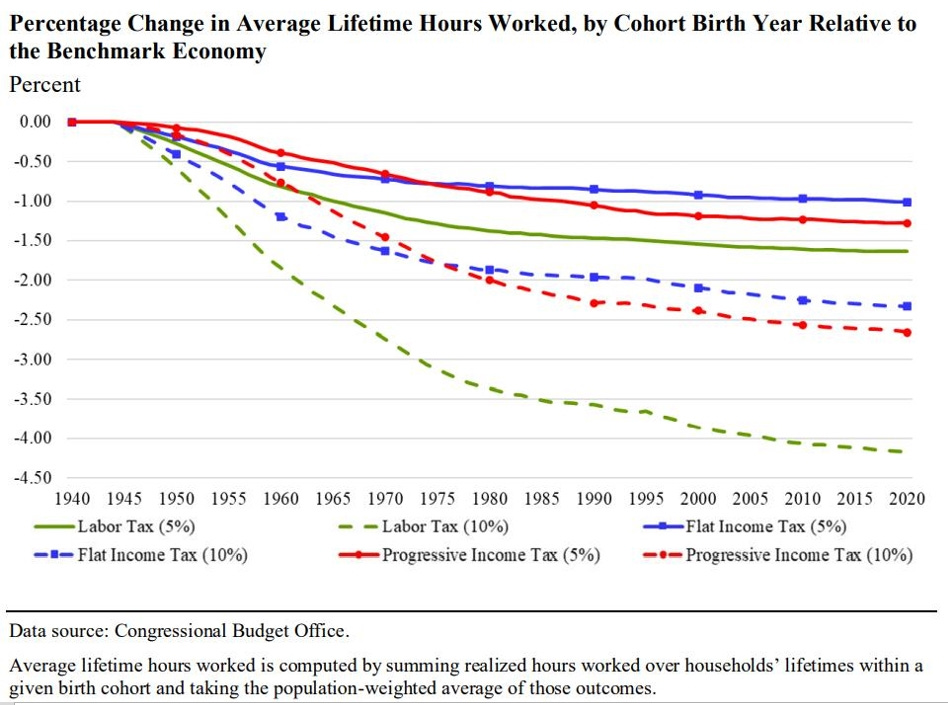
In March, 2021, the Congressional Budget Office issued a working paper considering what would happen if U.S. government expenditures were to consume an additional 5% to 10% of GDP, concluding that by 2030, because of higher taxes and higher borrowing, the level of GDP would be 3 to 10 percentage points lower. The largest losses are suffered by young Americans, who would go through more of their lives with a lower capital stock, leading to lower wages and hours worked. The losses are also highest when the spending is financed by progressive taxation.
As the Wall Street Journal has pointed out regarding expansive federal spending in response to COVID-19:
the damage from so much spending will come in two ways. First, in resources misallocated to government rather than into private hands to invest. Second, in the tax increases that the political class will eventually impose, perhaps starting as early as 2021. The costs of the coronavirus shock and the government response will hang over the economy for years. The sooner the economy starts growing again, the lower the costs.
Democrats in the Senate rejected the following amendments when offered to the March, 2021 COVID-19 spending bill:
The legislation is labeled Covid relief, and there’s some of that. But it’s sprinkled into a gigantic trough of taxpayer dollars on which Democratic constituencies will gorge. The Committee for a Responsible Federal Budget says about 1% of the bill goes for vaccines, 5% for pandemic public-health needs, and more than 15% for things completely unrelated to Covid. Nearly half is dedicated to “poorly targeted rebate checks and state and local government aid,” the committee says, including to jurisdictions “that have experienced little or no financial loss.” Democrats are betting this round of bread and circuses will win them the 2022 midterms. They think America has entered an era when voters can be bribed into supporting the party that showers them with cash—even though it’s adding to a debt their kids and grandkids must pay back with interest. Republicans took advantage of Senate rules Saturday to offer prudent amendments that—despite being defeated by Democrats—show voters how bad this bill is. Every Democratic candidate should be held to account for the party’s unanimous opposition to even modest improvements in the legislation. Republicans first tried reducing the package to something that only addressed Covid-related woes. They cut its cost by $1.2 trillion by limiting stimulus checks to the truly needy—rather than paying roughly 75% of Americans, as the Democrats’ bill does—and providing -- supplemental unemployment payments through July rather than September, as job numbers are already improving. Despite limiting the bill’s total cost, the GOP bill covered the actual costs of reopening schools and getting people vaccinated. Democrats still gave it the thumbs down. Trying to save future generations some debt payments, Republicans moved to reject stimulus checks for felons in prison; delete an $86 billion bailout for multiemployer union pension funds, an issue that’s bedeviled Congress for years and has nothing to do with Covid; and limit a generous tax credit that subsidizes ObamaCare insurance purchases available for households earning up to $500,000 a year to those making $132,000 or less. The GOP also tried removing what amounts to America’s first federal race-based reparations law: a provision allowing nonwhite farmers and ranchers to write off government loans because they’re “socially disadvantaged.” Republicans additionally tried to deny block grants to sanctuary states and cities. Democrats rejected all five amendments and even said no to requiring states to provide accurate monthly reports from states on nursing-home deaths. The GOP also focused on education. They suggested that the more days a school district is open, the more money it should get to manage Covid risks. Republicans also argued that if a school isn’t open five days a week, as much as $10,000 in Covid funding should follow students if parents send them to another school that’s open all week. Democrats shot both ideas down. GOP senators tried undoing formulas that send more money to blue states and cities than red states and small towns. They first suggested using a bipartisan formula approved a year ago 96-0 to allocate general state aid in the first 2020 Covid relief bill. Republicans also offered to distribute the 2021 bill’s $30.5 billion in transit funds by applying longstanding formulas rather than the bill’s new rule. The Democratic version gives 30% of the money to New York City—nearly twice as much as it’d normally receive. Both amendments went nowhere. Sen. Mitt Romney made a valiant effort to limit the $350 billion in state and local government aid so that it covers only actual budget shortfalls. California, for example, is projected to start its next fiscal year with a $19 billion surplus but gets $26.2 billion under this bill. Mr. Romney pointed out that 21 states have revenues at or above pre-Covid levels. Democrats told him to get lost.
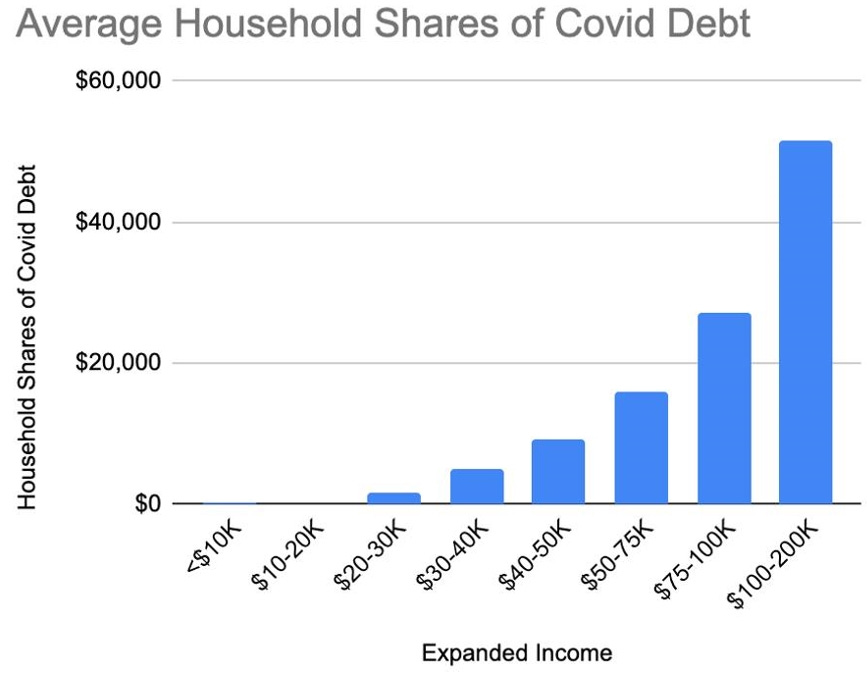
The following chart shows how future tax bills associated with paying for the resulting increased federal expenditures would have to be distributed. According to researchers at the American Enterprise Institute:
Even with the high progressivity of the current tax code, the bills are extraordinary. For those with incomes between $30,000 and $40,000, the tax hike needed today to pay for the combined stimulus packages would be about $5,000. Those with incomes between $40,000 and $50,000 would pay about $9,000, while those earning between $50,000 and $75,000 would have to fork over $16,000. That rises to $27,000 for incomes between $75,000 and $100,000, and $51,000 for incomes between $100,000 and $200,000. For higher earners, the bills climb so fast that they jump off the chart. The average for Americans with incomes between $500,000 and $1 million is $304,000. A typical American family, with $88,000 of income, faces a bill near $27,000.
And what if the debt is never paid off, just rolled over and added to? The typical American family can expect to receive $350 less in the way of government services or tax cuts, not just this year or next, but forever, just to pay the interest on the debt. That’s if interest rates stay low — the Congressional Budget Office projects an average of 1.3 percent through 2050.
As the Wall Street Journal reported in September, 2020:
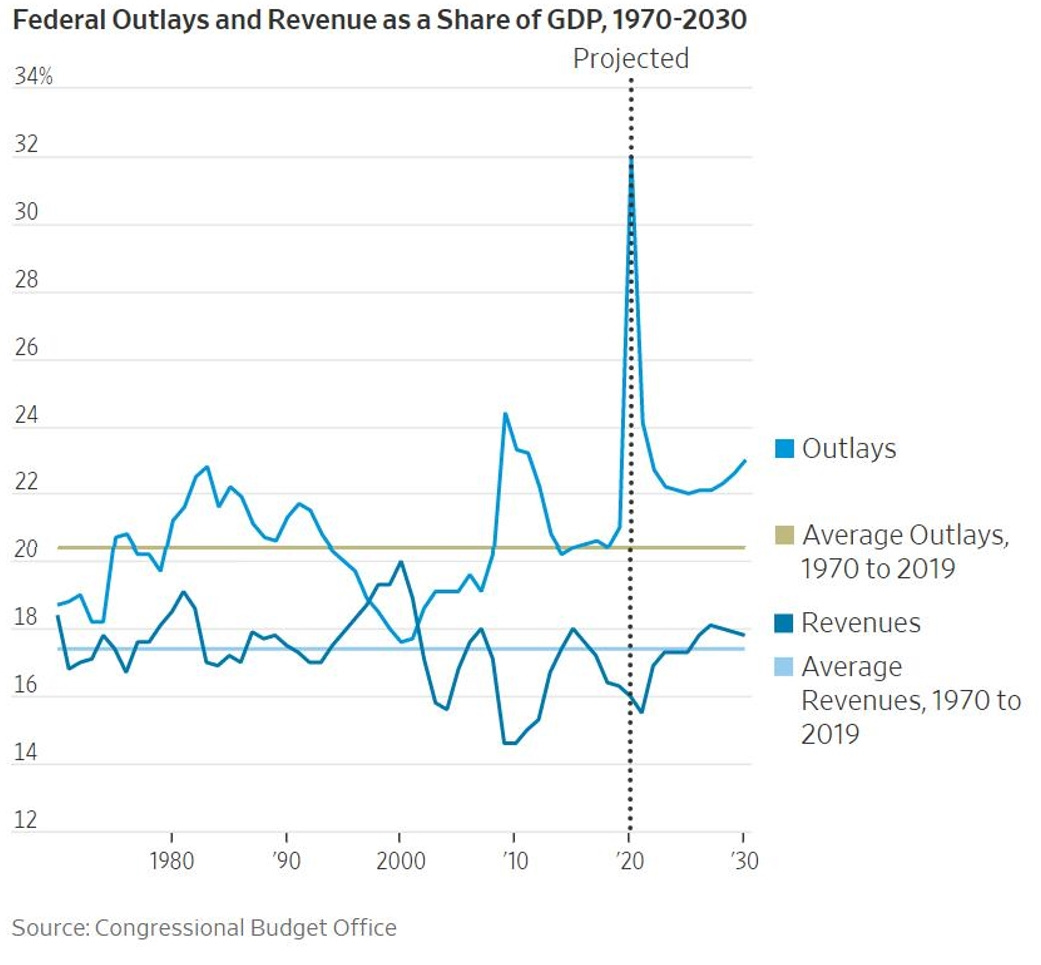
The spoilsports at the Congressional Budget Office reported Wednesday that the U.S. government will soon have a debt burden equal to America’s entire gross domestic product. Congratulations on this Italian-style fiscal milestone. One way or another, we’ll be paying this off for the rest of our lives. CBO reports that the lockdown recession and the explosion of spending this year will increase the budget deficit for fiscal 2020, which ends Sept. 30, to $3.3 trillion. At 16% of GDP, this will be the largest annual deficit since 1945, when there was merely a world war. The pandemic has become the fiscal equivalent of a war thanks to the economic lockdowns and the competition by both parties to ease voter anxieties with cash in an election year. The political class seems to agree this is a price worth paying since neither party wants to talk about it in the election campaign. The fight over the next phase of coronavirus relief has been whether to spend another $3 trillion (House Democrats) or merely $1 trillion or so (the White House). Either of those numbers would send the deficit higher than the 8.6% of GDP that CBO projects for fiscal 2021 …
[W]e thought some of our younger readers, still anticipating their prime earning years, might appreciate a look at the bar tab. CBO says federal debt held by the public will hit 98% of GDP this year. Debt held by the public is important because it is the amount America has to pay back with interest. CBO’s public debt estimates don’t include entitlements like Social Security and Medicare, which are political promises rather than binding contracts. They also exclude the liabilities of Fannie Mae and Freddie Mac, the housing giants guaranteed by taxpayers. And they don’t include the $1.5 trillion or so in student-loan debt that may end up in Uncle Sam’s lap [as noted at Student Loan Debt Statistics, this figure is now a record $1.75 trillion] … It’s important to appreciate how fast this increase has happened. As recently as 2007, before the financial panic and crash, debt held by the public was a mere 35% of GDP. As the nearby chart shows, the debt had risen to about 48% in the mid-1990s. But it declined amid faster growth and spending restraint after the GOP won the House in 1994. The pace of spending picked up across the George W. Bush years but the debt stayed under control.
Then came the 2008-09 recession, which Barack Obama and Nancy Pelosi addressed with a spending blowout and the slowest economic recovery since the 1930s. Public debt hit 76.4% of GDP by the time Mr. Obama left office, and it kept rising in President Trump’s first three years to 79.2%. Then the pandemic hit. On present trend—that is, without another trillion-dollar bonanza—debt will exceed 100% of GDP in 2021 and reach 107% in 2023 … To put it another way, the U.S. government will soon owe more than the American economy produces in a year. An optimist might say we can again gradually slow spending growth as we did after World War II. But that was before the rise of the entitlement state and its growing claims on tax revenue to pay retirees … Defense spending is already down to a low 3.3% of GDP amid rising global threats. Don’t look for money there.
As was mentioned in a previous essay, the Congressional Budget Office is the “official” calculator of federal budget deficits, but the CBO’s projections have been inaccurate in the past. That inaccuracy is due in part to the rules CBO follows in projecting deficits, which require CBO to only look at spending under a bill for a limited period of time, and to assume the provisions they analyze will not be renewed by future Congresses. That penchant for inaccuracy is likely playing out in CBO’s score of the most recent COVID-19 and federal stimulus and entitlement taken up in the House of Representatives. In November, 2021, as relayed in the Wall Street Journal:
The Congressional Budget Office … released its “official” cost estimates for the House tax and entitlement bill, but don’t believe it. The CBO gnomes aren’t lying about a 10-year deficit estimate of $367 billion. They’re obliged to score the bill under rules that Democrats have rigged with multiple tricks that disguise the real cost by trillions of dollars. Democrats phase out the biggest programs in the bill while paying for them with 10 years of tax increases. They phase-in other programs and off-load costs to the states. The Penn Wharton Budget Model estimates the House bill would cost nearly $4.6 trillion over 10 years if temporary provisions are made permanent, as most will be. The Committee for a Responsible Federal Budget (CRFB) pegs the cost at $4.9 trillion if temporary tax credits and programs are made permanent through 2031. This would add $1.5 trillion to deficits over the next five years without additional tax offsets … In sum, the House bill will cost $2 trillion to $3 trillion more than CBO is estimating because Democrats have camouflaged the costs. Penn Wharton estimates the bill’s tax increases and other revenue will yield about $1.8 trillion, but this doesn’t account for how the tax hikes will change the incentives to work and invest. Keep in mind that CBO this summer projected that annual deficits will already exceed $1 trillion on average through 2030, causing U.S. debt to swell by $12.8 trillion—and that’s before the infrastructure bill or this House bill. When the spending all kicks in, and the rich are all taxed out, the middle class will be hit with a huge tax increase. This is the most dishonest spending bill in American history.
James Capretta at the American Enterprise Institute elaborates on the new competition CBO is receiving from other independent forecasters of federal debt:
The economists and statisticians who built and run the Penn Wharton Budget Model (PWBM) must be doing something right because their work is a major irritant to a White House intent on rushing trillions of dollars in new spending through Congress. The president’s chief of staff is said to have dismissed the academic center’s estimates of the Build Back Better (BBB) agenda as tainted by ideology, and a press aid recently claimed the model’s output was “wrong on the math.” Of course, it is this kind of baseless criticism that is transparently political, not the PWBM. The PWBM is a nonpartisan initiative of the University of Pennsylvania and is directed by Kent Smetters, a tax official in the Department of the Treasury during the George W. Bush administration with a doctorate in economics from Harvard. He works with an expert staff of qualified analysts and reports to a roster of well-respected internal and external advisors on the model’s design and assumptions. All of this information, along with the PWBM cost estimates, are accessible online at the initiative’s website, as is a list of its financial supporters.
One last point on federal COVID-19 spending legislation is that it reveals another problem with the Senate filibuster rule, under which the votes of 60 Senators out of 100 (not just 50) are required to pass legislation. In a previous essay I described the problem a 60-vote threshold poses for enacting legislation necessary to limit otherwise ever-increasing automatic entitlement expenditures. Yet another problem with the Senate filibuster is that, combined with the fact that each state regardless of populations gets two Senators, the filibuster allows Senators from less-populated states to hold out their vote for legislation until the legislation grants people in their states disproportionate amounts of money. Researchers at the American Enterprise Institute have found that:
COVID-19 relief legislation offers a unique setting to study how political representation shapes the distribution of federal assistance to state and local governments. We provide evidence of a substantial small-state bias: an additional Senator or Representative per million residents predicts an additional 670 dollars in aid per capita across the four relief packages. Alignment with the Democratic party predicts increases in states’ allocations through legislation designed after the January 2021 political transition … [R]epresentation, and in particular the overrepresentation of small states, matters quite meaningfully for the distribution of federal funds across states and localities. We find this small-state bias to be of substantial economic significance: having an additional Senator or Representative per million residents predicts an additional $670 dollars in aid per capita across the four relief packages combined. This is equivalent to 2% of U.S. income per capita (U.S. Census Bureau, 2019b). Across all four bills, we estimate that the small-state bias altered the allocation of around $30 billion in relief funds, which is equivalent to the funding this same legislation allocated to Pfizer, Moderna, the GAVI Vaccine Alliance, Regeron, Johnson & Johnson, AstraZeneca, GlaxoSmithKline, Eli Lily and Company, Merck, and Novavax for the development, manufacturing, and distribution of COVID-19 vaccines and therapeutics.
In the next essay, we’ll explore how COVID-19 pandemic “stimulus” and federal entitlement spending has accelerated the reduction in labor force participation.
Links to all essays in this series: Part 1; Part 2; Part 3; Part 4; Part 5

