The Diminishing American Labor Force – Part 5
The COVID-19 pandemic and the accelerated reduction in labor force participation.
In previous essays I explored how, prior to the COVID-19 pandemic, the labor force participation rate was already shrinking. And at the same time fewer younger people are participating in the labor force, we are entering a phase in which there will be a large increase in older people as the Baby Boom generation begins turning 65.
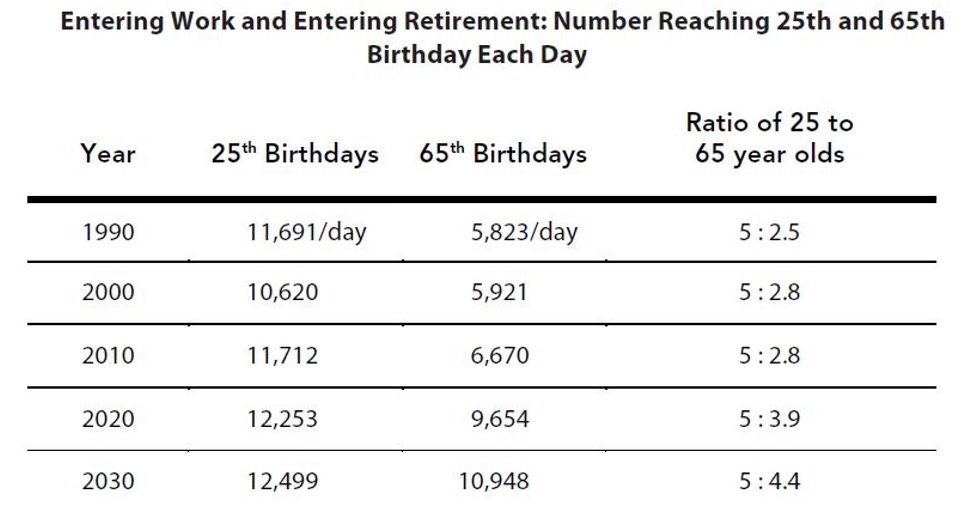
Over the next few decades, there will almost be as many people turning 65 as are turning 25 in a given year.
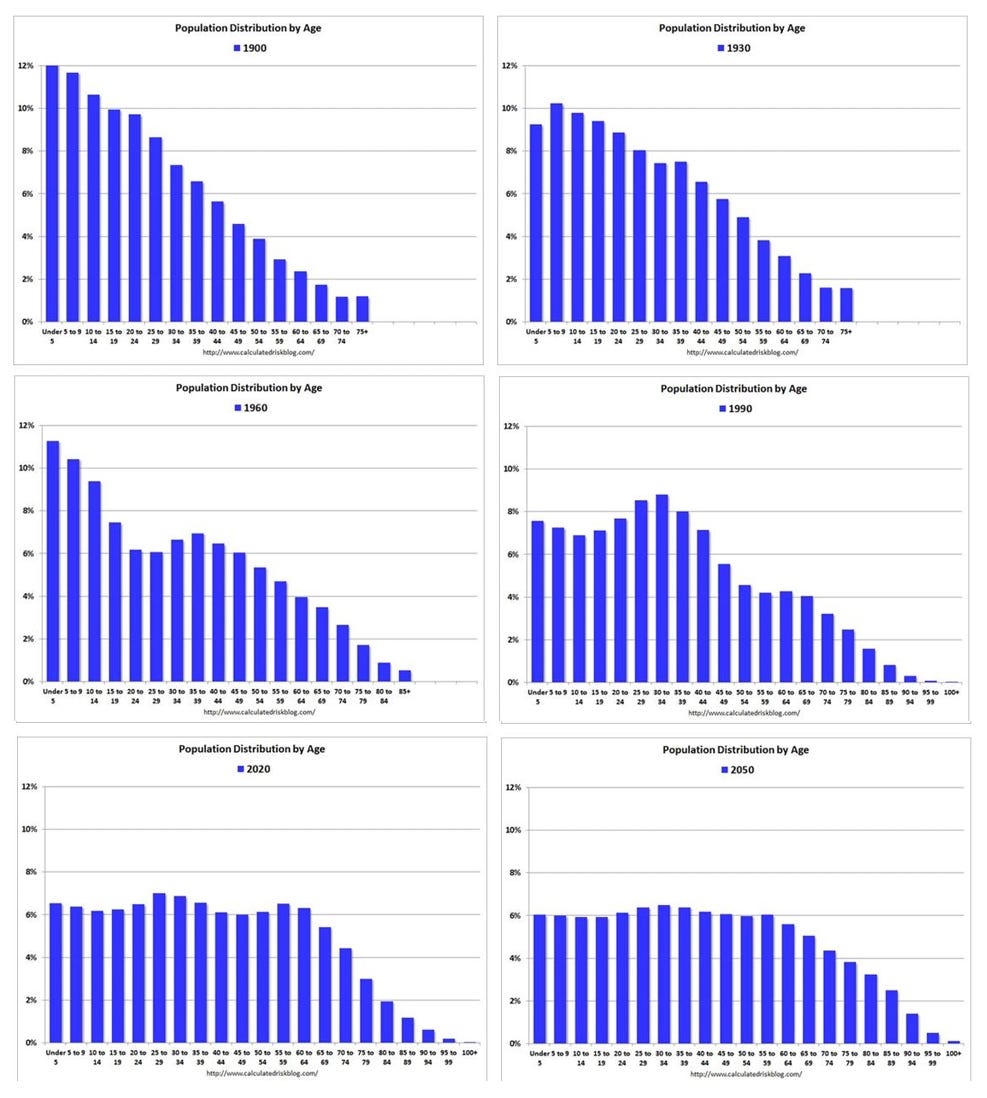
According to Census Bureau figures and projections, the graphs below show the numbers of people in each age group every thirty years, from 1900 to 2050, and reveal a trend toward relatively many more older people.
As one anthropologist has written, “The old require enormous wealth transfers from the young to cover the costs of their healthcare and pensions. When a population ages too quickly, the money runs out. Either the old aren’t taken care of or the system won’t be able to afford to care for the young when they grow old. Thus, rapidly aging countries can decline economically and lose political power on the world stage.”
In this essay, I’ll explore how the increases in unemployment benefits and other federal welfare programs over an extended period of time has accelerated that already startling reduction in the labor force participation rate.
Federal unemployment benefits enacted following COVID-19 has disincentivized work. Anecdotally, as reported by one entrepreneur in the restaurant business seeking workers at the time:
We started making the calls last week, just as our furloughed employees began receiving weekly Federal Pandemic Unemployment Compensation checks of $600 under the Cares Act. When we asked our employees to come back, almost all said, “No thanks.” If they return to work, they’ll have to take a pay cut. The starting wage for a line cook in one of our restaurants is $15 an hour. These cooks receive at least $1 an hour in tips, so at a minimum they make $16 an hour, or $640 before taxes for a 40-hour week. The overwhelming majority of our laid-off cooks qualified for Oregon unemployment compensation of 1.25% of their annual gross wages weekly, or $416 in our example. The extra $224 a week provides a strong incentive to return to work. But as of this week, that same employee receives $1,016 a week, or $376 more than he made as a full time employee. Why on earth would he want to come back to work? This has had the perverse effect of making it impossible for us to hire enough people even for our limited takeout and delivery business at a time of rapidly rising unemployment. It will be an even bigger problem once we are allowed to reopen our dining rooms. And it will persist at least until July 31, when the unemployment bonus expires. I’d have to offer my cooks $25.40 an hour to match what the government is paying them not to work.
A saloon keeper named Mike Brand reported:
Many of his servers and bartenders have declined offers to come back to work, he said. Some are fearful of catching the virus; others don’t want to give up their unemployment benefits, which currently pay them more than they would earn at the restaurant. He believes that as enhanced unemployment benefits expire he will have an easier time finding workers.
And in the aggregate, University of Chicago economist Casey Mulligan analyzed the effects of the COVID-related federal supplemental unemployment benefits on work incentives in the states, and found as follows:
In 21 states and the District of Columbia, households can receive the wage equivalent of $25 an hour in benefits with no one working. In 19 states, benefits are the equivalent of $100,000 a year in salary for a family of four with two unemployed parents. In all but two of the blue states, the $300 supplemental unemployment insurance benefit plus other welfare can pay more than the wage equivalent of a $15 minimum wage. In the blue states that haven’t suspended the $300 bonus, the average annual unemployment insurance benefit for a family of four with two parents out of work is more than $72,000. Median household income in the U.S. is about $68,000.
The Congressional Budget Office reviewed the estimated effects of the extension of those unemployment benefits, and concluded:
If the benefit of $600 per week was extended through January 2021, benefits would exceed 100 percent of potential earnings for roughly five of every six recipients of unemployment benefits from August 2020 to January 2021 … The additional $600 per week in benefits decreases the incentive to work more for people who expect to have lower earnings than it does for people who expect to have higher earnings because that additional amount is a larger percentage of lower-earning workers’ potential earnings … In CBO’s assessment, the extension of the additional $600 per week would probably reduce employment in the second half of 2020, and it would reduce employment in calendar year 2021. The effects from reduced incentives to work would be larger than the boost to employment from increased overall demand for goods and services.
A study by professors at the University of Chicago found that “Since the $600 UI [unemployment insurance] payment was targeted to generate 100% earnings replacement based on mean earnings, this $600 payment tends to imply greater than 100% earnings replacement for those with less than mean earnings.” The result is that 68% of laid-off workers were making more unemployed. One in five unemployed workers made twice as much not working while the bottom 10% -- generally part-timer workers -- collected three times more. The economists also examined benefit differences by state and industry, estimating that the median laid-off retail worker now makes 42% more unemployed and that “[j]anitors working at businesses that remain open do not necessarily receive any hazard pay, while unemployed janitors who worked at businesses that shut down can collect 158% of their prior wage.” The study found that in 37 states the average (median) worker will make at least 41% more not working.
The uniquely large size of the COVID-19 unemployment benefits, compared to current and previous unemployment rates, is shown below. As Matt Weidinger has explained, “As displayed in Figure 3, the combined up to 73 weeks of federal benefits payable under EUC08 [emergency unemployment compensation] and EB [extended benefits] while it was fully federally funded—and resulting maximum of 99 weeks of all benefits—far exceeds prior levels of federal benefits. Before the Great Recession, no temporary federal program had provided more than 33 weeks of benefits.”
That expanded federal benefit expired at the end of July, 2020. As Weidinger explains:
So what do claims for unemployment insurance (UI) benefits — the most frequent metric of the state of the labor market — show since the $600 bonus expired? As displayed below, the data show both initial and continuing claims for UI benefits fell more rapidly after the bonuses ended. That suggests more are returning to work now than before the bonuses expired in late July. As Figure 1 shows, the number of persons collecting UI benefits fell by 21.5 percent between the week ending July 25 and the most recent week of data ending September 5. That’s more than double the 10.5 percent decline in the six weeks leading up to July 25 – the last week for which the bonuses were payable. That means UI caseloads have fallen twice as fast since the bonuses expired than in the last weeks they were being paid.
Regarding fraud and waste in the COVID-19 federal benefits programs, the Foundation for Economic Education reports that
the sheer speed, haste, and unprecedented scope of federal spending in response to the COVID-19 pandemic—an astounding $6 trillion total—has led to truly unthinkable levels of fraud. Indeed, a new report shows that the feds potentially lost $200 billion in unemployment fraud alone. “More than $200 billion of unemployment benefits distributed in the pandemic may have been pocketed by thieves, according to ID.me, a computer security service that 19 states — accounting for 75% of the national population — use to verify worker identities,” Yahoo Money reports. “That's more than triple the official government estimate of $63 billion based on the 10% pre-pandemic fraud rate.” To put that $200 billion figure in context, it is equivalent to $1,400 lost to fraud per federal taxpayer.
As reported in Axios, “Criminals may have stolen as much as half of the unemployment benefits the U.S. has been pumping out over the past year, some experts say.” The article continues:
Unemployment fraud during the pandemic could easily reach $400 billion, according to some estimates, and the bulk of the money likely ended in the hands of foreign crime syndicates — making this not just theft, but a matter of national security … When the pandemic hit, states weren't prepared for the unprecedented wave of unemployment claims they were about to face. They all knew fraud was inevitable, but decided getting the money out to people who desperately needed it was more important than laboriously making sure all of them were genuine … Blake Hall, CEO of ID.me, a service that tries to prevent this kind of fraud, tells Axios that America has lost more than $400 billion to fraudulent claims. As much as 50% of all unemployment monies might have been stolen, he says … Haywood Talcove, the CEO of LexisNexis Risk Solutions, estimates that at least 70% of the money stolen by impostors ultimately left the country, much of it ending up in the hands of criminal syndicates in China, Nigeria, Russia and elsewhere. “These groups are definitely backed by the state,” Talcove tells Axios. Much of the rest of the money was stolen by street gangs domestically, who have made up a greater share of the fraudsters in recent months … Scammers often steal personal information and use it to impersonate claimants. Other groups trick individuals into voluntarily handing over their personal information. “Mules” — low-level criminals — are given debit cards and asked to withdraw money from ATMs. That money then gets transferred abroad, often via bitcoin.
Testimony given to Congress in March, 2022, reported that “Recent estimates for fraudulent payouts range from a low of $87 billion to as high as $400 billion. Prior to the pandemic, the US spent $27 billion on all unemployment benefits in 2019, meaning the current minimum estimate for fraud suggests losses equivalent to three full years of benefit payments in more normal times.” The Department of Labor’s Inspector General stated that “at least $163 billion … could have been paid improperly.”
A 2024 report (“Examining Widespread Fraud in Pandemic Unemployment Relief Programs”) authored by the majority staff of the US House Committee on Oversight and Accountability, identifies why this abuse occurred. The report recounts official government fraud and misspending figures as follows:
[T]he U.S. Government Accountability Office (GAO) estimates that about 11 to 15 percent of total benefits paid during the pandemic were fraudulent, totaling between $100 to $135 billion.
The Department of Labor (DOL) Office of Inspector General (OIG) estimated that at least $191 billion in pandemic UI [unemployment insurance] payments could have been improperly paid, with a significant portion attributable to fraud.
In August 2023, DOL reported that the PUA program had a total improper payment rate of 35.9 percent.
Unofficial estimates suggest improper unemployment benefit payments may have reached twice the official level, potentially costing taxpayers $400 billion or “about a 40 percent loss rate.” The report cites several factors contributing to massive fraud, including outdated IT systems, and highlights that “Congress and executive branch actions created problems for states and the economy” while placing special blame on the flawed design of the Pandemic Unemployment Assistance (PUA) program Congress hastily created in March 2020, and which failed to require applicants to provide proof of prior employment and wages.
This collective waste was the product of what might have been a “perfect storm” in which, during the COVID-19 pandemic, the increased risk-aversion of Democrat-controlled states led to greater unemployment, which led to a greater demand for federal stimulus spending. As reported in the Wall Street Journal in late September, 2020:
Speaker Nancy Pelosi said this weekend that House Democrats plan to pass a new $2.4 trillion relief bill “that puts money in people’s pockets.” So it’s worth highlighting how the $2.2 trillion Cares Act that passed in March has disproportionately helped blue states that imposed stricter coronavirus lockdowns and have been slower to recover economically ... [S]even Democratic states hauled in 24% more in transfer payments relative to their share of the U.S. population while the seven GOP states collected 23% less. Yet these Democratic states continued to boast much higher unemployment rates in August: New York (12.5%), California (11.4%), Illinois (11%), New Jersey (10.9%), Washington (8.5%), Connecticut (8.1%) and Oregon (7.7%) versus Utah (4.1%), Georgia (5.6%), Arizona (5.9%), Indiana (6.4%), Texas (6.8%), Florida (7.4%) and Tennessee (8.5%).
As Matt Weidinger pointed out in November, 2020:
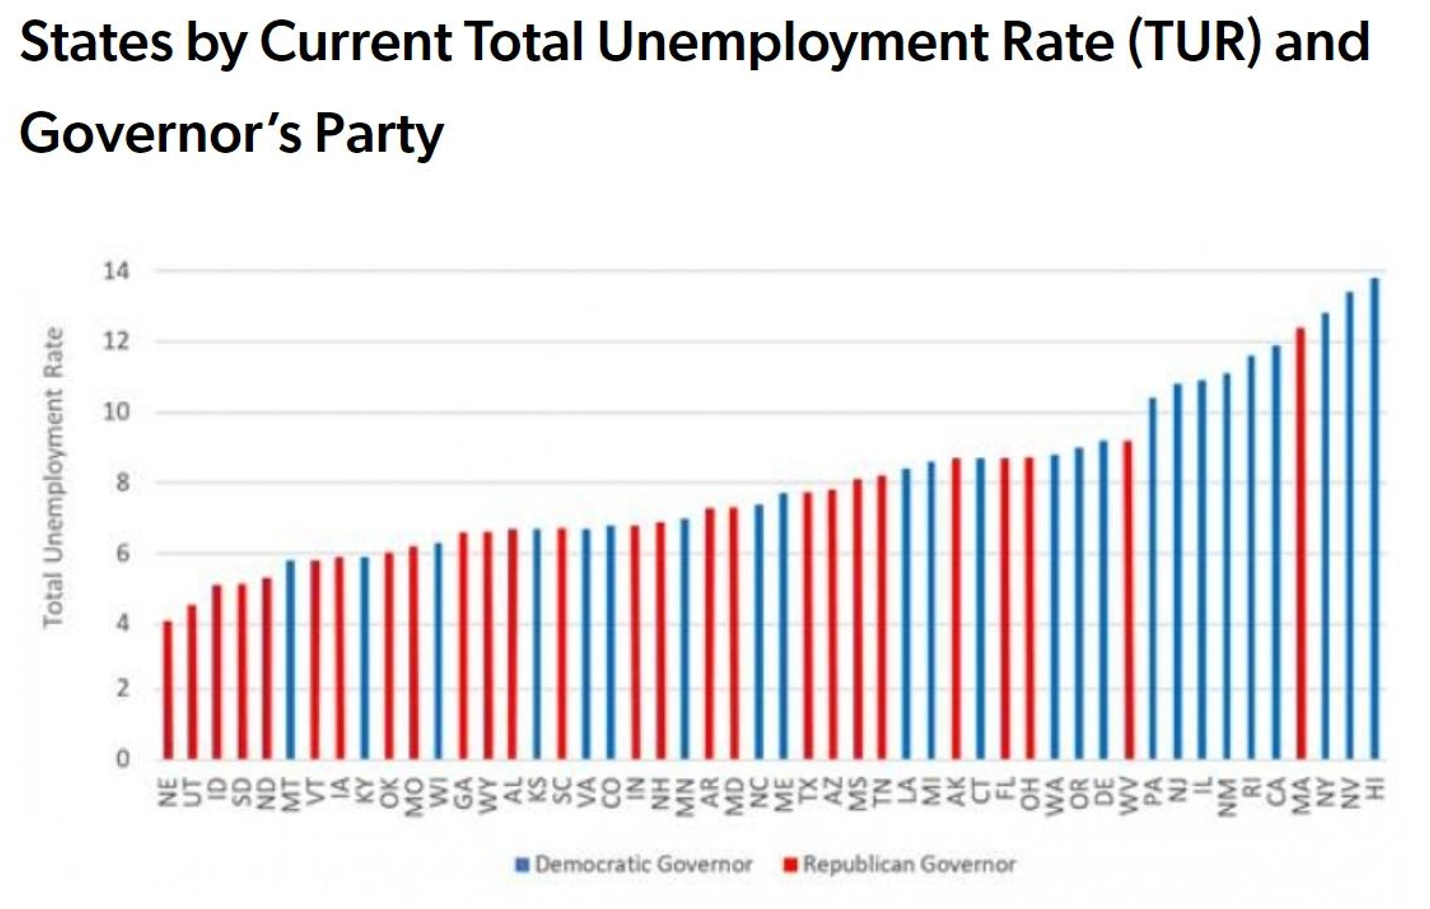
A review of current state unemployment rates reveals a stark partisan divide between the states with the highest and lowest unemployment rates. As the chart below reflects, nine of ten states with the highest recent unemployment rates have a Democratic governor (the tenth is deep-blue Massachusetts, currently led by Republican governor Charlie Baker). Meanwhile eight of the ten states with the lowest unemployment rates have a Republican governor (with the two exceptions being otherwise red states of Montana and Kentucky).
A March, 2021, Commerce Department report showed Republican-leaning states were leading economic growth in the U.S. with South Dakota, Texas and Utah reporting the highest growth.
As Michael Barone explains, much of this political division is attributed to different understandings of reasonable risk aversion:
America’s constitutional federal system, and the latitude both the Trump and Biden administrations have given to state governments, has produced distinctly different Democratic and Republican coronavirus policies. Democrats have tended to impose mask mandates, to order the closing of restaurants and retail businesses, and to require distancing rules. Republicans have tended to push for full-time instruction in schools and to allow open-air gatherings in playgrounds and beaches. Yes, there are exceptions here and there. But what’s most striking is the prevalence of partisan patterns. Look at the maps of school closings, mask mandates, and mask usage, and the partisan patterns are obvious. The economic results are obvious, too. With more restrictions, Democratic states have seen higher unemployment and less economic growth than Republican states. Why the partisan correlation? The answer is that different responses to a pandemic reflect different degrees of risk aversion, and political differences often reflect differences in risk aversion, as well.
The enormous expansion of federal benefits during the COVID pandemic has had long-lasting and deleterious effects on workforce participation as of 2025. As the Wall Street Journal recently reported:
Biden officials … boosted food-stamp allotments and waived work requirements for able-bodied adults. A recent Wall Street Journal article reported the case of an unemployed worker who worried that accepting a job with a “smallish paycheck” would end his eligibility for food stamps and Medicaid. How many more are like him? Republicans have floated stiffer work requirements for welfare programs and fixing the accounting gimmicks that states use to scam more federal Medicaid dollars. Good ideas. By our calculation, simply returning to pre-pandemic Medicaid spending levels, adjusted for inflation, could generate more than $1.4 trillion in savings over a decade. Progressives claim that Republicans want to take food and healthcare away from the poor and sick. But the reality is that Mr. Biden’s welfare expansions have mostly benefited those who can support themselves but for any number of reasons choose not to.
This concludes this series of essays on labor force participation in American today. The next multi-part series of essays will consider federal tax policy.
Links to all essays in this series: Part 1; Part 2; Part 3; Part 4; Part 5


