


Data on Discrimination Against Women – Part 1
Claims regarding an earnings gap, and high-risk jobs.
In the previous series of essays, we looked at data on the prevalence and extent of racism in America. In this series of essays, we’ll look at data on the prevalence and extent of discrimination against women.
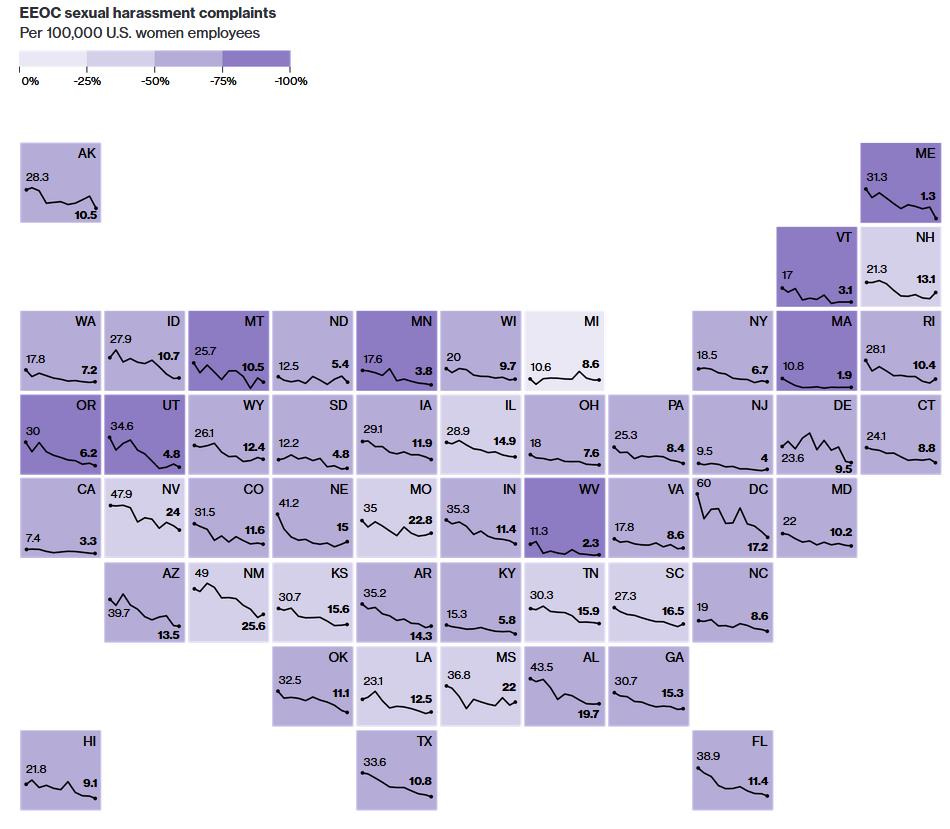
Over the 20 years preceding 2017, the number of sexual harassment complaints filed with the federal Equal Employment Opportunity Commission in each state has gone down. Note that employers cannot prevent people from filing complaints with the EEOC.
The Earnings Gap
A study prepared for the U.S. Department of Labor in 2009 concluded there was no evidence that discrimination -- and not other factors (including time spent away from work so they could spend more time with family or friends) -- was the cause of disparity in wages between men and women.
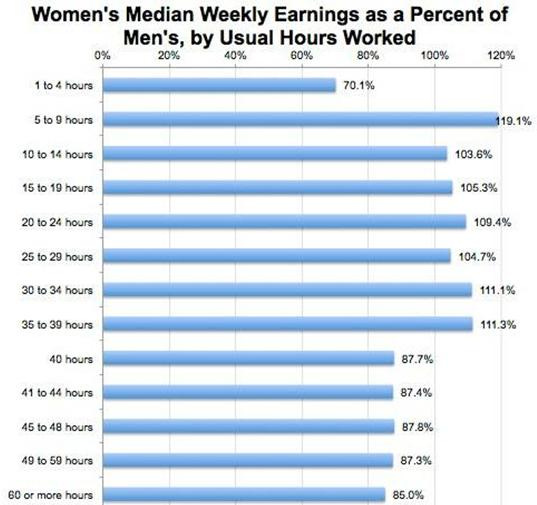
Generally, more than twice the percentage of all women as men work part-time, making a decision that affects their lifetime wages. And among part-time workers, women’s median weekly earnings are higher than men’s. Other such studies are compiled here.
A study of Uber drivers shows discrimination does not play a role in the gender pay gap. Uber pays drivers based on a relatively simple, transparent formula that takes into account how long your ride is in miles, how long the ride takes, and potentially, a surge multiplier where sometimes there’s, excessively high demand. As explained by the study authors:
So the fare itself is determined by an algorithm, which is gender-blind. The dispatch itself is gender-blind. And pay structure’s tied directly to output and not negotiated … [D]oes that mean that discrimination accounts for zero percent of whatever pay gap you find or don’t find between male and female Uber drivers? That’s correct.
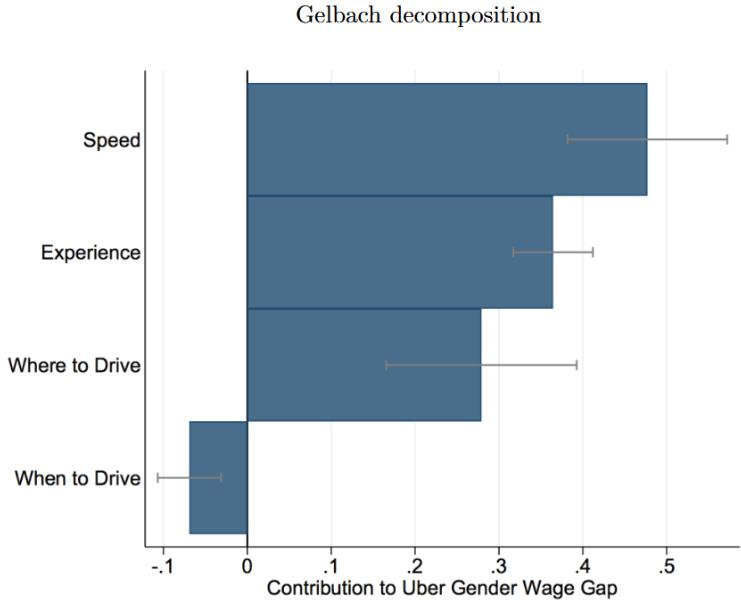
The researchers conclude:
First, driving speed alone can explain nearly half of the gender pay gap (48%). Second, over a third of the gap can be explained by returns to experience (36%), a factor which is often almost impossible to evaluate in other contexts that lack high frequency data on pay, labor supply, and output. The remaining [approximately] 20% of the gender pay gap can be explained by choices over where to drive. Men’s willingness to supply more hours per week (enabling them to learn more) and to target the most profitable locations shows that women continue to pay a cost for working reduced hours each week … We show that -- much like with traditional jobs -- there is a gender pay gap. However, unlike earlier studies, we are able to completely explain the pay gap with three main factors related to driver preferences and learning: returns to experience, a pay premium for faster driving, and preferences for where to drive … Overall, our results suggest that, even in the gender-blind, transactional, flexible environment of the gig economy, gender-based preferences [on the part of employees] can open gender earnings gaps. The preference differences that contribute to pay differences in professional markets for lawyers and MBAs also lead to earnings gaps for drivers on Uber, suggesting they are pervasive across the skill distribution and whether in the traditional or gig workplace.
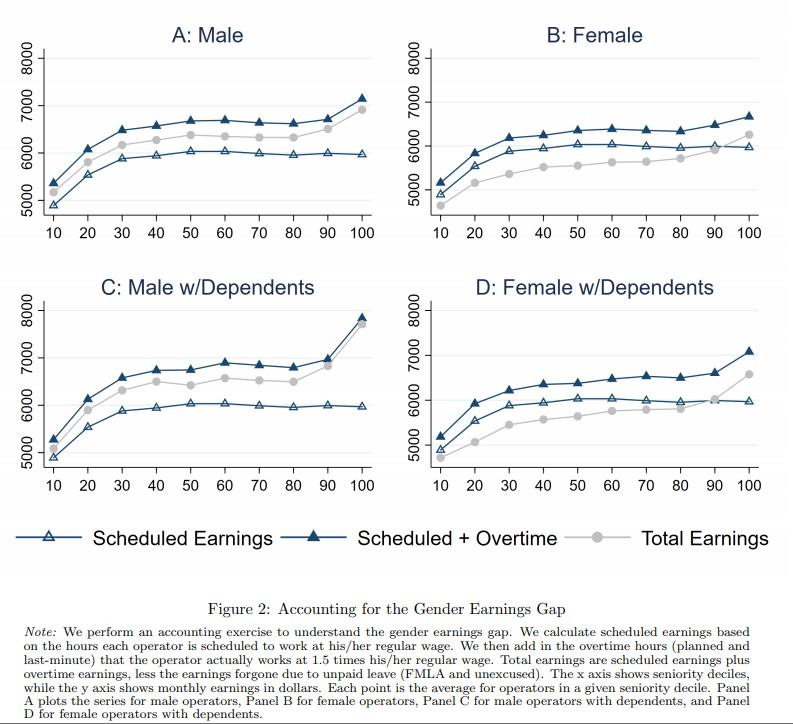
A study focusing on bus and train operators in a unionized environment similarly found that:
Even in a unionized environment, where work tasks are similar, hourly wages are identical, and tenure dictates promotions, female workers earn $0.89 on the male-worker dollar (weekly earnings). We use confidential administrative data on bus and train operators from the Massachusetts Bay Transportation Authority (MBTA) to show that the weekly earnings gap can be explained entirely by the workplace choices that women and men make. Women value time and flexibility more than men. Women take more unpaid time off using the Family Medical Leave Act (FMLA) and work fewer overtime hours than men. Men and women plan to work similar overtime hours when they are scheduled three months in advance, but men actually work nearly 50% more overtime hours than women. Women with dependents value time away from work more than do men with dependents. When selecting work schedules, women try to avoid weekend, holiday, and split shifts more than men … Conditional on seniority, which dictates choice sets, the weekly earnings gap can be explained entirely by differences in operator choices of hours, schedules, and routes.
As Mark Perry explains:
Let’s investigate the claim that the gender pay gap is a result of discrimination by looking at some of the data on wages and hours worked by gender and by marital status and age in the BLS report for 2019:
1. Among full-time workers (those working 35 hours or more per week), men were more likely than women to work a greater number of hours … For example, 25% of men working full-time worked 41 or more hours per week in 2019, compared to only 14.5% of women who worked those hours, meaning that men working full-time last year were nearly twice as likely as women to work 41 hours per work or more … Further, men working full-time were also 2.2 times more likely than women to work 60+ hour weeks: 5.6% of men worked 60 hours per week or more in 2019 compared to only 2.5% of women who worked those hours … Also, women working full-time were 2.4 times more likely than men to work shorter workweeks of 35 to 39 hours per week: 10.2% of full-time women worked those hours in 2019, compared to only 4.3% of men who did so. What’s especially interesting is that men working 35-39 hours per week last year earned only 96% of what women earned working those same hours ($566 median weekly earnings for men vs. $591 for women), i.e., there was a 4% gender earnings gap in favor of female workers for that cohort … Bottom Line: When the BLS reports that women working full-time in 2019 earned 81.5% of what men earned working full-time, that is very much different from saying that women earned 81.5% of what men earned for doing exactly the same work while working the exact same number of hours in the same occupation, with exactly the same educational background and exactly the same years of continuous, uninterrupted work experience, and with exactly the same marital and family (e.g., number of children) status. As shown above, once we start controlling individually for the many relevant factors that affect earnings, e.g., hours worked, age, marital status, and having children, most of the raw earnings differential disappears.
Mark Perry’s similar analysis of the 2020 data can be found here.
High-Risk Jobs
Men also overwhelmingly occupy high-risk jobs, and are consequently compensated for the higher risk.
As Mark Perry further explains:
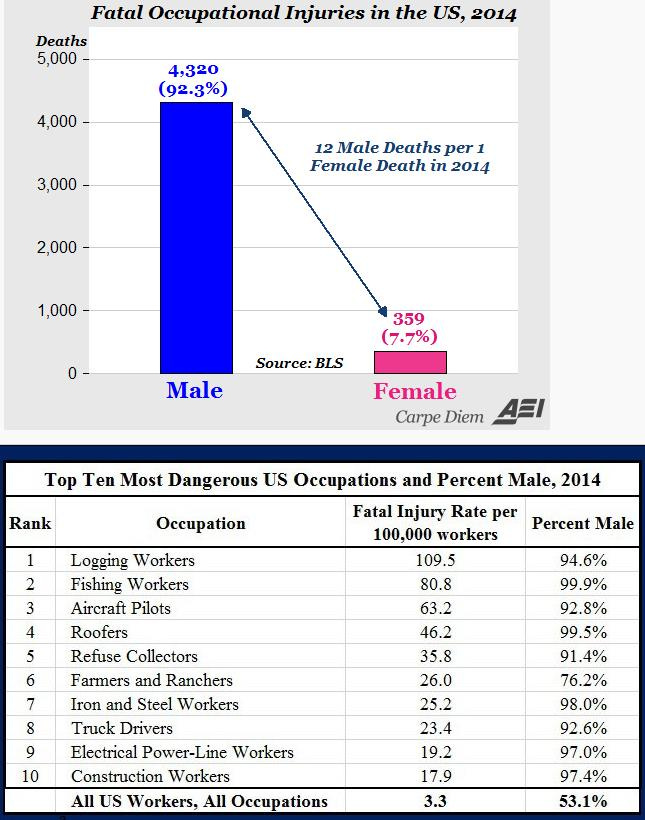
“Equal Occupational Fatality Day” tells us how many years and days into the future women will be able to continue to work before they will experience the same number of occupational fatalities that occurred for men in the previous year. Last December, the Bureau of Labor Statistics (BLS) released final data on workplace fatalities in 2018, and a new “Equal Occupational Fatality Day” can now be calculated. As in previous years, the top graphic above shows the significant gender disparity in workplace fatalities in 2019: 4,896 men died on the job (91.8% of the total) compared to only 437 women (8.2% of the total). The “gender occupational fatality gap” in 2019 was again considerable — more than 11 men died on the job for every woman who died while working. Based on the BLS data for 2019 for workplace fatalities by gender (and assuming those figures will be approximately the same in 2020), the next “Equal Occupational Fatality Day” will occur ten years from now – on May 9, 2031. That date symbolizes how far into the future women will be able to continue working before they experience the same loss of life that men experienced in 2020 from work-related deaths. Because women tend to work in safer occupations than men on average (frequently reflected in lower wages), they have the advantage of being able to work for a decade longer than men before they experience the same number of male occupational fatalities last year. Economic theory tells us that the “gender occupational fatality gap” explains part of the “gender earnings gap” because a disproportionate number of men work in higher-risk, but higher-paid occupations like iron and steelworkers (97.8% male) roofers (97.4% male), construction trades (96.6%) and electric power line workers (95.9% male); see BLS data here. The bottom chart above shows that for the 10 most dangerous US occupations in 2019 based on fatality rates per 100,000 workers by industry and occupation men represented more than 90% of the workers in nine of those 10 occupations (all except “Farmers and Ranchers”) and more than 96% of the workers in five of the 10 occupations. On the other hand, women far outnumber men in relatively low-risk industries, sometimes with lower pay to partially compensate for the safer, more comfortable indoor office environments in occupations like office and administrative support (70.9% female), education, training, and library occupations (73.6% female), and healthcare (75.4% female). The higher concentrations of men in riskier occupations with greater occurrences of workplace injuries and fatalities suggest that more men than women are willing to expose themselves to work-related injury or death in exchange for higher wages. In contrast, women on average, more than men, prefer lower-risk occupations with greater workplace safety and are frequently willing to accept lower wages for the reduced probability of work-related injury or death. The reality is that men and women demonstrate clear gender differences when they voluntarily select the careers, occupations, and industries that suit them best, and those voluntary choices contribute to differences in earnings that have nothing to do with gender discrimination.


Indeed, the most recent evidence tends to show that there is a general bias in favor of women. As John Tierney writes at City Journal:
Scholars, journalists, politicians, and activists will lavish attention on a small, badly flawed study if it purports to find bias against women, but they’ll ignore—or work to suppress—the wealth of solid research showing the opposite. Three decades ago, psychologists identified the “women-are-wonderful effect,” based on research showing that both sexes tended to rate women more positively than men. This effect has been confirmed repeatedly—women get higher ratings than men for intelligence as well as competence—and it’s obvious in popular culture. “Toxic masculinity” and “testosterone poisoning” are widely blamed for many problems, but you don’t hear much about “toxic femininity” or “estrogen poisoning.” Who criticizes “femsplaining” or pretends to “believe all men”? If the patriarchy really did rule our society, the stock father character in television sitcoms would not be a “doofus dad” like Homer Simpson, and commercials wouldn’t keep showing wives outsmarting their husbands. (When’s the last time you saw a TV husband get something right?) Smug misandry has been box-office gold for Barbie, which delights in writing off men as hapless romantic partners, leering jerks, violent buffoons, and dimwitted tyrants who ought to let women run the world. Numerous studies have shown that both sexes care more about harms to women than to men. Men get punished more severely than women for the same crime, and crimes against women are punished more severely than crimes against men. Institutions openly discriminate against men in hiring and promotion policies—and a majority of men as well as women favor affirmative-action programs for women. The education establishment has obsessed for decades about the shortage of women in some science and tech disciplines, but few worry about males badly trailing by just about every other academic measure from kindergarten through graduate school. By the time boys finish high school (if they do), they’re so far behind that many colleges lower admissions standards for males—a rare instance of pro-male discrimination, though it’s not motivated by a desire to help men. Admissions directors do it because many women are loath to attend a college if the gender ratio is too skewed. Gender disparities generally matter only if they work against women. In computing its Global Gender Gap, the much-quoted annual report, the World Economic Forum has explicitly ignored male disadvantages: if men fare worse on a particular dimension, a country still gets a perfect score for equality on that measure. Prodded by the federal Title IX law banning sexual discrimination in schools, educators have concentrated on eliminating disparities in athletics but not in other extracurricular programs, which mostly skew female. The fact that there are now three female college students for every two males is of no concern to the White House Gender Policy Council. Its “National Strategy on Gender Equity and Equality” doesn’t even mention boys’ struggles in school, instead focusing exclusively on new ways to help female students get further ahead … Of course, females in the past did suffer from outright discrimination, but most American institutions eliminated those barriers at least 40 years ago. Women have been a majority of college graduates since 1982 and dominate by many other key measures. They not only live longer than men but also benefit from a higher share of federal funding for medical research. They’re much less likely to be fatally injured on the job or commit suicide. They receive the lion’s share of Social Security and other entitlement payments (while men pay the lion’s share of taxes). They decide how to spend most of the family income. Women initiate most divorces and are much likelier to win custody of the children. While men are ahead in some ways—politicians love to denounce the “gender pay gap” and the “glass ceiling” supposedly limiting women—these disparities have been shown to be largely, if not entirely, due to personal preferences and choices, not discrimination.