Mismeasuring Economic Inequality – Part 1
What official measures leave out – namely, most government benefits.
In this series of essays, we’ll explore another way that government misleads by mismeasuring, namely its greatly exaggerating the appearance of economic inequality in America by distorting both ends of the comparison used to measure that inequality.
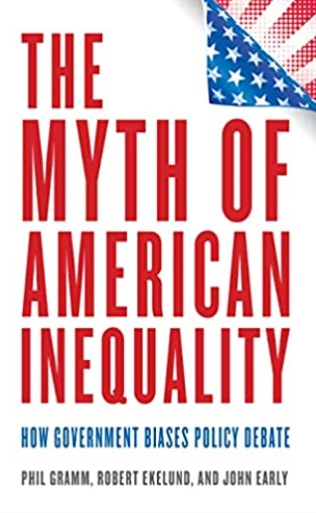
This glaring mismeasure is examined in depth by Phil Gramm, Robert Ekelund, and John Early in their book The Myth of American Inequality: How Government Biases Policy Debate. The authors introduce the mismeasurement in the following way:
The Economist magazine in 2020 summed up the contemporary public assessment of income inequality as follows: “It is a truth universally acknowledged that inequality in the rich world is high and rising.” This view permeates the American political and economic debate and is generally accepted across American society … [Yet] from the ramp-up of funding for the War on Poverty in 1967 to 2017, annual government transfer payments to the average household in the bottom 20 percent of the income distribution rose more than fourfold in inflation-adjusted dollars from $9,677 to $45,389. And yet the official poverty measures tell us that the percentage of people living in poverty hardly changed during that fifty-year period … The annual Census report on income and poverty showed that median household income was down 2.9 percent in 2020 and 3.3 million additional Americans had fallen into poverty. These numbers failed the laugh test in a year when federal spending, mostly on transfer payments, rose almost 50 percent and personal savings exploded. The Census explained that its income measure didn’t count stimulus checks, since many were paid as refundable tax credits, and didn’t count any other noncash benefits like food stamps. Census reported that if it had counted some of these missing payments, median household income would have risen by 4.0 percent instead of falling 2.9 percent, and the poverty rate would have fallen 2.6 percent instead of rising 1.0 percent … The bottom quintile can consume more than twice its Census income only because the Census does not count two-thirds of transfer payments as income for those who receive them.
In particular:
In measuring income, the Census Bureau chooses not to count over two-thirds of all transfer payments made by federal, state, and local governments as income to the recipients of those transfer payments … Remarkably, the Census Bureau chooses to count only $0.9 trillion of that $2.8 trillion in government transfer payments as income for the recipients of those transfers, counting only eight of the more than one hundred federal transfer payment programs and only a select number of state and local transfer payment programs. Excluded from the measurement of household income are some $1.9 trillion of government transfers—programs like refundable tax credits, where beneficiaries get checks from the Treasury; food stamps, where beneficiaries buy food with government-issued debit cards; and numerous other programs such as Medicare and Medicaid, where government directly pays the bills of the beneficiaries. Americans pay $4.4 trillion a year in federal, state, and local taxes, 82 percent of which are paid by the top 40 percent of household earners. Even though most households never see this money, because it is withheld from their paychecks, the Census Bureau does not reduce household income by the amount of taxes paid when it measures income inequality. The net result is that in total the Census Bureau chooses not to count the impact of more than 40 percent of all income, which is gained in transfer payments or lost in taxes.
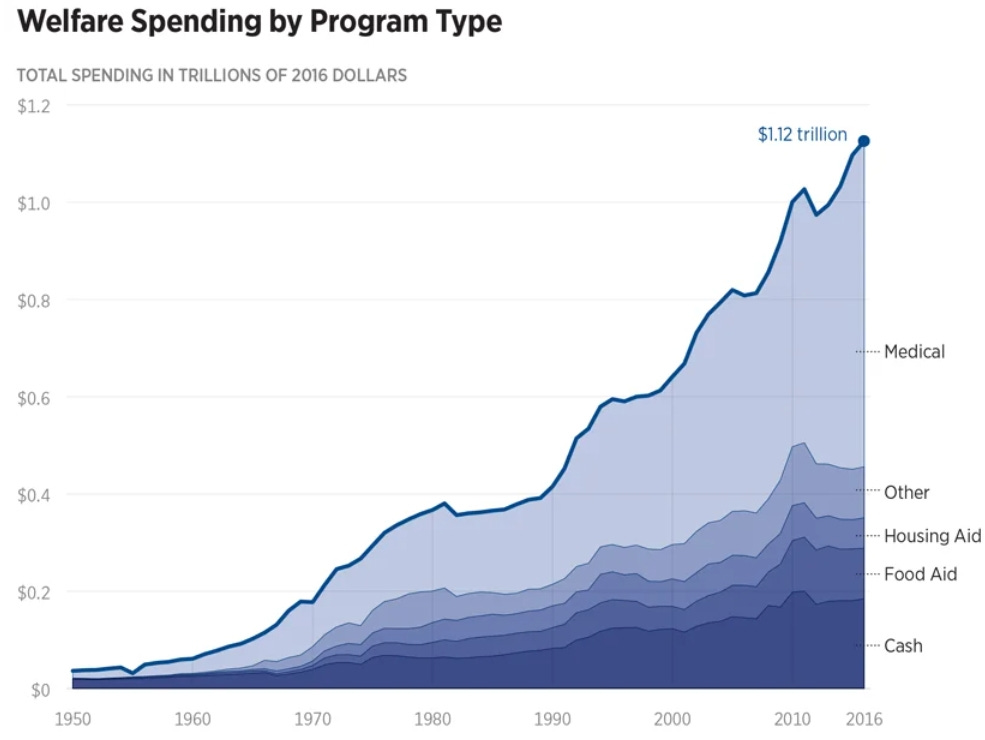
The federal government has dramatically increased spending on benefits programs over the years.
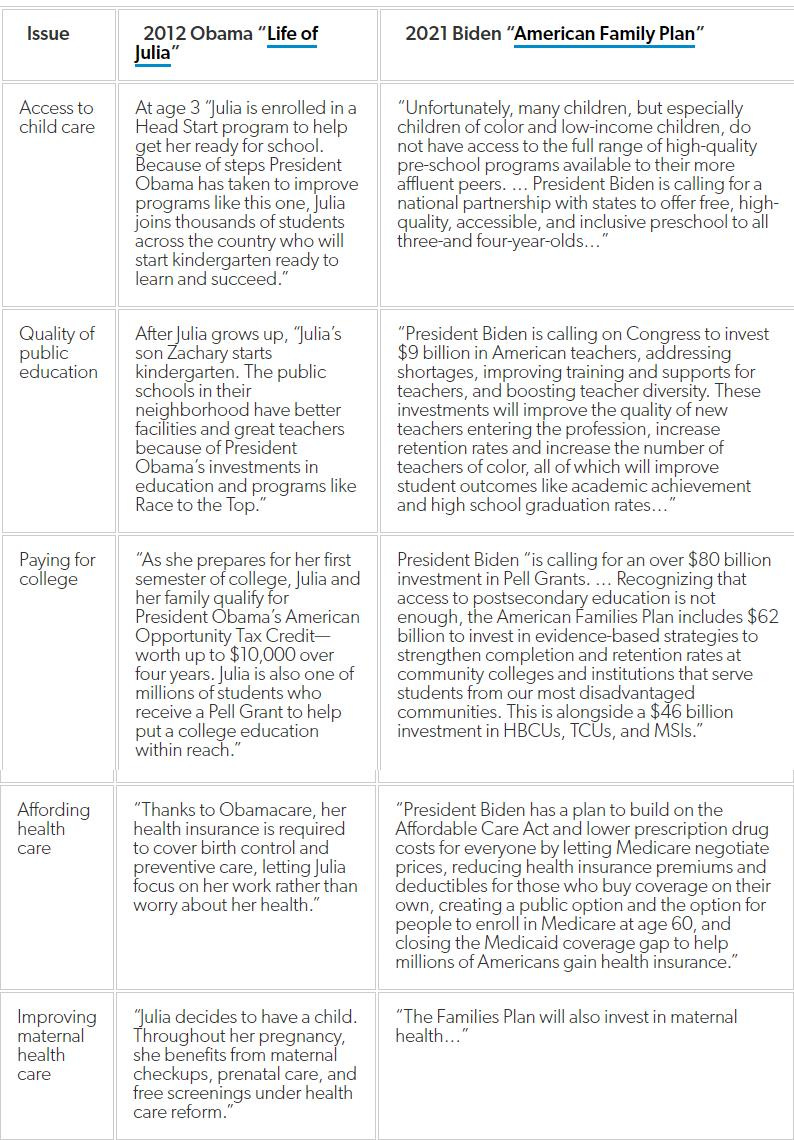
And this trend is growing increasingly worse. Following the Obama Administration’s plan for “Julia,” the Biden Administration supports going much further, and expanding the already vast benefits programs that were touted for “Julia” only a few years earlier. As Matt Weidinger explains:
When President Obama ran for reelection in 2012, his campaign crafted a slideshow about a fictional woman named Julia and all the ways Obama’s first term would improve her life — and how Mitt Romney would quickly dismantle all that “progress.” The “Life of Julia” quickly became the subject of mockery over, as one critic described it, the Obama administration’s “cradle-to-grave welfare mentality.” We know how that story ended — with the Obama-Biden team winning a second term and government only continuing to grow during the Trump administration that followed. But now less than a decade later, the Biden administration’s latest $1.8 trillion spending plan released today makes key elements of the Life of Julia seem almost like a limited-government dystopia. Consider the following comparison of some of the benefits extolled by the Obama campaign in 2012 and the Biden administration’s description of the need for dramatic expansions in the very same benefits and programs in 2021:
Naturally, the list above doesn’t include the new and expanded benefits and programs the Biden administration is now proposing that Julia was never offered, including $3,600 annual child allowances, a new “national comprehensive paid family and medical leave program” providing “up to $4,000 a month,” and permanent extensions of the “Summer Pandemic-EBT” nutrition program and ACA premium reduction payments. All of which makes the Biden administration’s vision for America under its new American Family Plan look a lot like the Life of Julia on steroids.
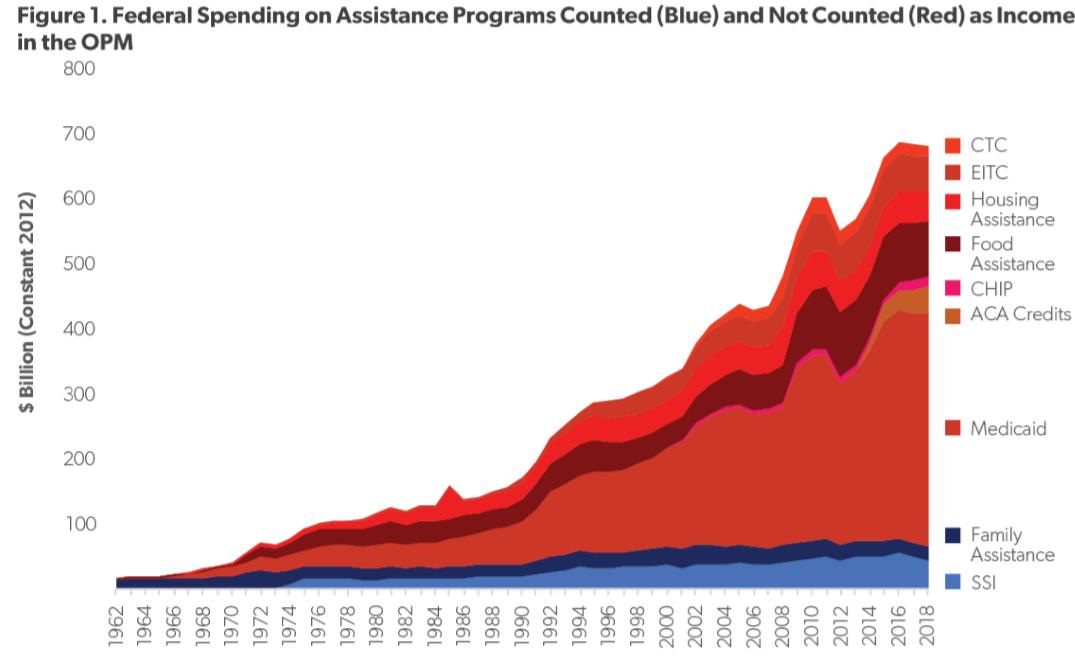
Just about all the government benefit programs that exist today aren’t counted in official calculations of economic inequality. Indeed, annual federal spending on antipoverty programs not counted as income has grown far more rapidly in recent years than those programs whose benefits are counted as income in the Census Bureau’s Official Poverty Measure.
Once one realizes that accounting error the government makes to determine economic inequality, the magnitude of economic inequality drops dramatically:
Accounting for all transfer payments and taxes yields a measure of income inequality that is only one-fourth as large as the official Census measure … [I]t is much harder to argue that the distribution of income is unfair when the ratio of the income for the top 20 percent of households to the bottom 20 percent is 4.0 to 1 rather than the 16.7 to 1 ratio found in the official Census numbers … [I]ncome inequality is not rising. It has in fact fallen by 3.0 percent since 1947 as compared to the 22.9 percent increase shown in the Census measure. The official measure of the poverty rate, which uses the Census Bureau definition of income, does not count two-thirds of all transfer payments as income to the recipients. As a result, for more than fifty years, the measured income of low-income Americans has been substantially understated. As we will show, when you count all transfer payments as income to the households that receive the payments, the number of Americans living in poverty in 2017 plummets from 12.3 percent, the official Census number, to only 2.5 percent. There are certainly people who are physically or mentally unable to care for themselves and have fallen through the cracks in the system that delivers transfer payments, but, for all practical purposes, poverty due to a lack of public or private support has been virtually eliminated in America.
It's not as though the government doesn’t already have access to the information relevant to more accurate measurement of economic inequality:
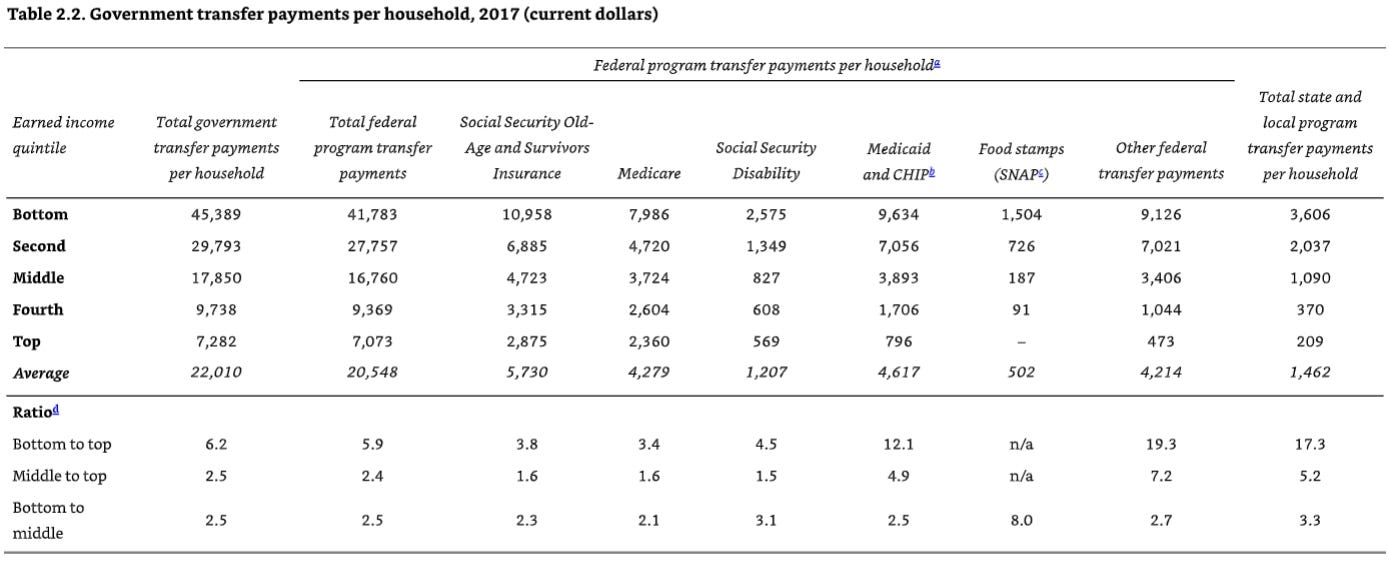
Getting the facts straight largely requires only that we use all the available statistics collected by our statistical agencies to count all income received and taxes paid and to adjust their value over time for inflation using the most accurate measures available. The facts are hiding in plain sight in official data sources and generally agreed-upon research. The analysis in this book simply applies them … Almost three-quarters of a century ago, the Census established a procedure for measuring income by counting only “cash” payments—currency, check, or direct deposit to a recipient’s bank account—as income. Because in 1947 over 90 percent of all employment compensation and government assistance was received in cash payments and it was difficult to measure the value of noncash payments, the decision was made to define income simply as the total of all cash payments received. At the time, cash payments received were reasonable approximations of total income. Since then, however, the value of employer-paid benefits has expanded, and the War on Poverty has created an explosion of new programs, such as Medicare, Medicaid, food stamps, housing subsidies, and numerous others that have not been classified as cash payments. None of these new sources of income have been counted as income by the Census. Unlike the uncertainties concerning the value of noncash payments in 1947, the Census and other government agencies now collect and report data on all employer-paid benefits and noncash transfer payments. But, even with detailed information reported separately by various government entities, the Census continues to follow a procedure established seventy-four years ago and does not count noncash payments as income. In 2017, the average household with earned income in the bottom 20 percent of all households received more than $45,000 in government transfer payments; yet, remarkably, Census failed to count nearly $32,000 of those transfers as income to the recipients. This substantial omission has caused the Census calculations of income inequality and the poverty rate to be seriously overstated. In addition, the expanding number and size of these transfer payments has caused the overstatement of inequality and poverty to grow over time. Food stamps began as a pilot program in 1961 and became a standardized nationwide income-subsidy program in 1964.1 Initially beneficiaries were required to buy food stamps at a price lower than their store value. But the purchase requirement was eliminated in 1977, and beneficiaries now receive free debit cards that they can spend on the food of their choice. Because the debit cards can be used only for food, the Census has considered them “in-kind” payments, and their value is not counted as income for the recipients of the debit cards. Medicare and Medicaid began in 1967. Government pays physicians and hospitals for services consumed by beneficiaries, but because the beneficiaries do not touch the money, Census counts these programs as in-kind and does not count the benefits as income for the beneficiaries. The Housing and Urban Development Act of 1968 greatly expanded the number and size of housing subsidies for low-income households. Since the payments go to the landlords or to local governments that manage the public housing projects, Census does not count payments from any of those programs as income either. The Earned Income Tax Credit began in 1975. It has since been expanded, and an additional Child Tax Credit has been added. These tax credits are refundable. The tax filer receives money from the US Treasury for the full value of the tax credit in excess of any income tax liability. Census does not count this money as income, classifying it as a “negative tax.” In 1947, government transfer payments were only about 2.5 percent of total personal income, and the Census counted more than 90 percent of those payments as income to the recipients. By 1979, transfer payments had risen to 11.8 percent of the nation’s personal income, and less than half of those transfer payments were counted as income by the Census. By 2017, transfer payments were a whopping 18.2 percent of all personal income, but Census counted only one-third of those transfers as income to the households that received them … The result is that today two-thirds of all government transfer payments to individuals and households are not counted by Census in its income estimates … The result of these and other, lesser shortcomings is a gross overstatement of both income inequality and poverty … Except where otherwise indicated, data in this book relate to households … The resources available to American households are not determined only by the $13.0 trillion of income they earn producing value with their labor and with the investment of the fruits of their thrift. The total resources available for consumption are also determined by the $2.8 trillion of government transfer payments received, $0.2 trillion of private transfer payments, and the $4.4 trillion of taxes paid. After receiving transfer payments and paying taxes, American households in 2017 had $11.7 trillion of available income, one-fourth of which had been redistributed through taxes and transfer payments. Table 2.2 shows federal, state, and local transfer payments, which totaled $2.8 trillion and accounted for almost 22 percent of all household income in 2017. Over 41 percent of those transfers payments went to bottom-quintile households, and 27 percent went to households in the second quintile. Transfer payments made from more than one hundred different federal programs constituted 93 percent of all government transfers … The remaining 7 percent came from programs funded by states and municipalities. Table 2.2. Government transfer payments per household, 2017 (current dollars) … Table 2.2 shows the magnitude of government transfers by quintile. The average household in the bottom quintile received an astonishing $45,389 in government transfer payments annually, more than nine times greater than its earned income. The second quintile received a total of $29,793 in government transfer payments, about two-thirds as much as the bottom quintile, and the middle quintile received $17,850 … Obviously, when a computation excludes 59 percent of the income from the bottom quintile and only 1 percent of the income from the top quintile, the result will be a dramatically skewed measure of income inequality. The statistics in Table 2.2 incorporate $1.9 trillion of annual transfer payments missing from Census calculations. These missing transfers have been obtained from official government sources such as the Department of Commerce Bureau of Economic Analysis National Income and Product Accounts, the US Government Accountability Office, the Office of Management and Budget (OMB), the American Housing Survey, the Annual Surveys of State and Local Government Finances, and the Congressional Research Service … The official statistics compiled by our government do not reflect the economic progress we see everywhere because those statistics are wrong. They are wrong not because of measurement error but because, by design, they don’t count most government transfer payments as income to the recipients and fail to account for taxes paid as income lost to the taxpayers … The data needed to fix these and other design failures in our official measures of well-being are all available in plain sight from other official government sources.
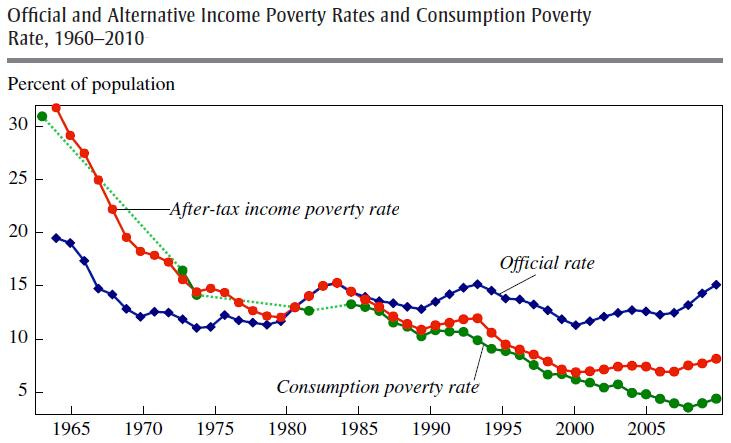
As other researchers have explained this phenomenon, benefits in kind (that is, benefits in a form other than cash) and aid through the tax system (such as the Earned Income Tax Credit) are not counted as part of the official definition of poverty, and so the four major poverty reduction programs (Medicaid, food stamps, Section 8 housing vouchers, and the EITC) are not included. If they were, and the consumption of those benefits were considered in determining poverty, the actual poverty rate would be much lower. How the official poverty is calculated, and its misleading nature as a result, has not been changed, perhaps because federal payouts to localities across the country are linked to the existing official poverty rate, and there is reluctance to risk losing federal funding as a result of a better and more accurate poverty measure. Other studies show large reductions in child poverty rates, when more accurate measures of available resources are used.
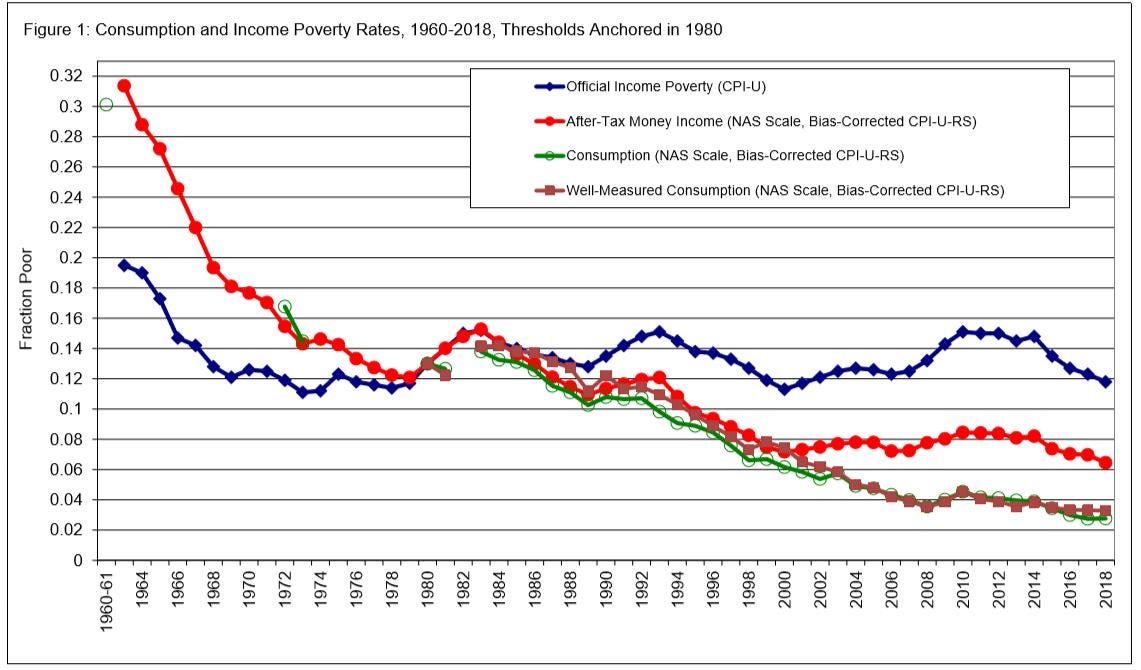
Using the standard of living of the poor in 1980, the consumption poverty rate fell by more than 10 percentage points, from 13.0 percent in 1980 to 2.8 percent in 2018, while the official poverty rate fell by only 1.2 percentage points over that period.
Researchers have found that:
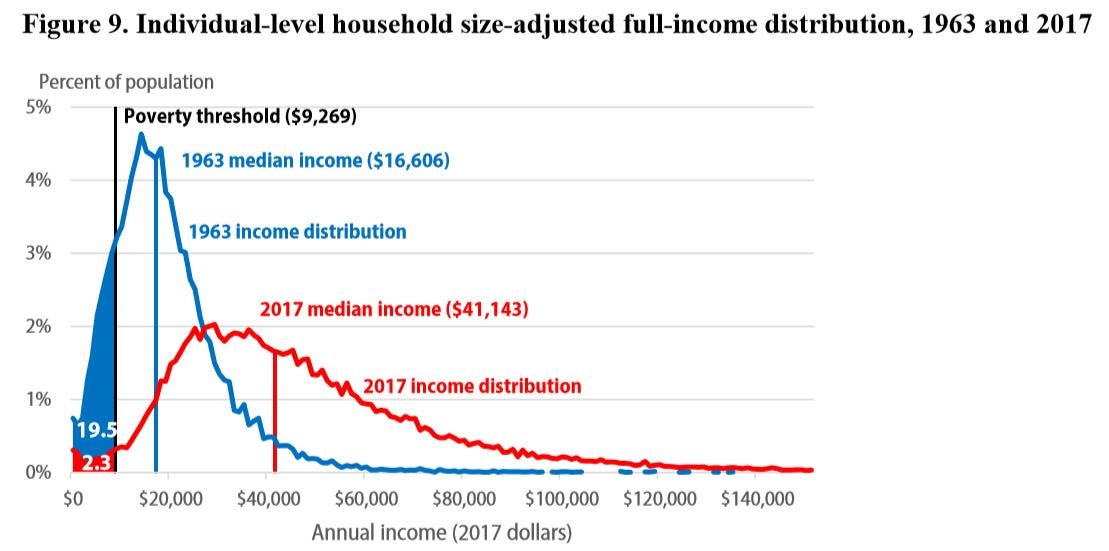
[W]e create a poverty measure, which we refer to as the Full-income Poverty Measure (FPM). This measure maintains the same 1963 poverty rate as the Official Poverty Measure, matching Johnson’s baseline poverty rate (Johnson 1965). We hold poverty thresholds constant in inflation-adjusted terms using the Personal Consumption Expenditure (PCE) price index. Additionally, unlike the Official Poverty Measure, we include all sources of income, including the market value of food stamps (now the Supplemental Nutrition Assistance Program, or SNAP), the school lunch program, housing assistance, and health insurance. Finally, we consider the household, rather than the family, as the unit within which individuals share resources. Based on Johnson’s standard, our Full-income Poverty Rate in 2017 is 2.3 percent, well below the Official Poverty Rate of 12.3 percent. Consequently, while recognizing that today’s expectations for minimum living standards have evolved from those in the 1960s, a relatively small share of Americans now live in poverty based on President Johnson’s initial standards.
When this full-income poverty measure is used, it’s clear there have been “substantial real income gains (including transfers) throughout the income distribution over the past five decades.”
In the next essay in this series, we’ll look at another important thing official measures of income inequality leave out, namely what higher-income people lose through taxes.



Paul, This is important stuff. How many politicians actually recognize this for what it is worth? (Knowing your Congressional background...) Why don't right-leaning politicians expose this -- this is easy enough for EVERYONE to understand. Just curious about your thoughts. Great piece. Thanks.