Politics Over the Last Couple of Decades – Part 5
Ideological correlations with geography, urban and rural.
In this essay, we’ll explore ideological correlations with geography, urban and rural.
Generally, Democrats predominate in urban areas, and Republicans in rural areas.
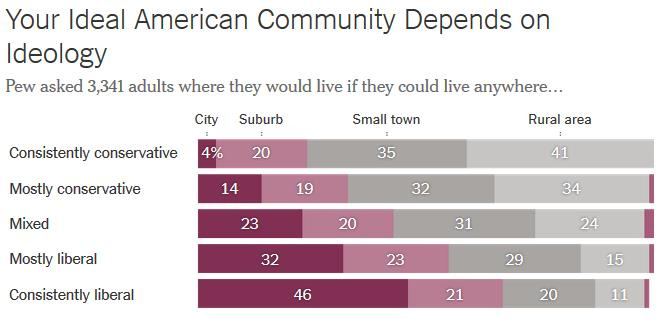
Conservatives much prefer to live in small towns and rural areas, whereas liberals much prefer to live in big cities.
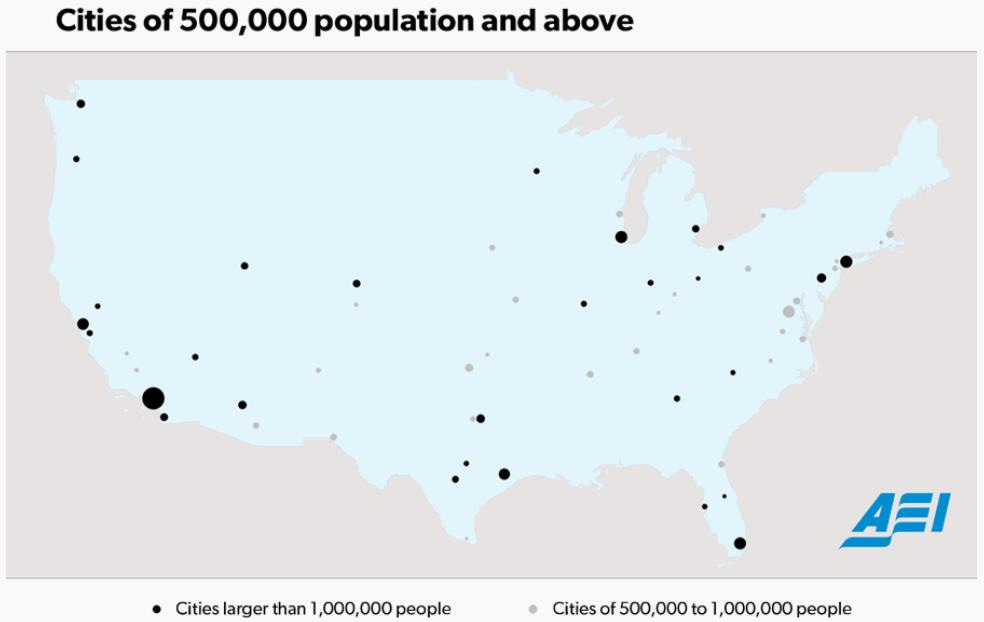
As Charles Murray has written, “As of the 2010 census, 28 percent of Americans still lived in rural areas or in cities of fewer than 25,000 people. Another 30 percent lived in stand-alone cities (i.e., not satellites of a nearby bigger city) of 25,000–499,999. Fourteen percent lived in satellites to cities with at least 500,000 people. Twenty-eight percent lived in the sixty-two cities with contiguous urban areas containing more than 500,000 people—the same proportion that lived in places of fewer than 25,000 people. The 28 percent who live in the large contiguous urban areas don’t take up much space, as the map below shows.”
As Murray continues: “The black circles represent cities of more than a million people. They contain 21 percent of the population. The gray circles identify cities of 500,000 up to a million, with 7 percent of the population. The sizes of the circles roughly correspond to the size of the geographic spaces they encompass (that’s why the circle for New York is smaller than the one for Los Angeles). Now look at all that space outside the circles. Specifically, look at the area including the state in which you live, and consider what a small geographic portion of your state consists of big cities—something that’s true of even the most urban states … It’s not that the major cities aren’t important. But America remains far more a nation of medium-sized cities, small cities, towns, and wide open spaces than people often think.”
The added space in rural areas shapes a different rural culture. As Brad Wilcox and Michael Pugh write:
Economically, red states typically offer more affordable housing, hotter job markets and lower taxes, all of which appeal to young and middle-aged men and women aiming to start or grow their families. Culturally, red states are more likely to prioritize marriage and family life, offer parents more educational choices and show a greater commitment to law and order, which are plusses to many family minded Americans. The family friendly culture of many red states also seems more likely to turn the hearts and minds of young adults to marriage. These financial and cultural features of red-state life end up being more important than the suite of avowedly pro-family policies of their blue counterparts.
The general political views of rural and urban residents are also significantly different.
Increases in land use regulations generally are correlated with higher home prices.
Increased housing regulations make it so only large, wealthy developers can afford to comply with them, which in turn causes city governments to try to exact even more concessions from large developers, further slowing housing projects and discouraging other developers from applying for housing permits.
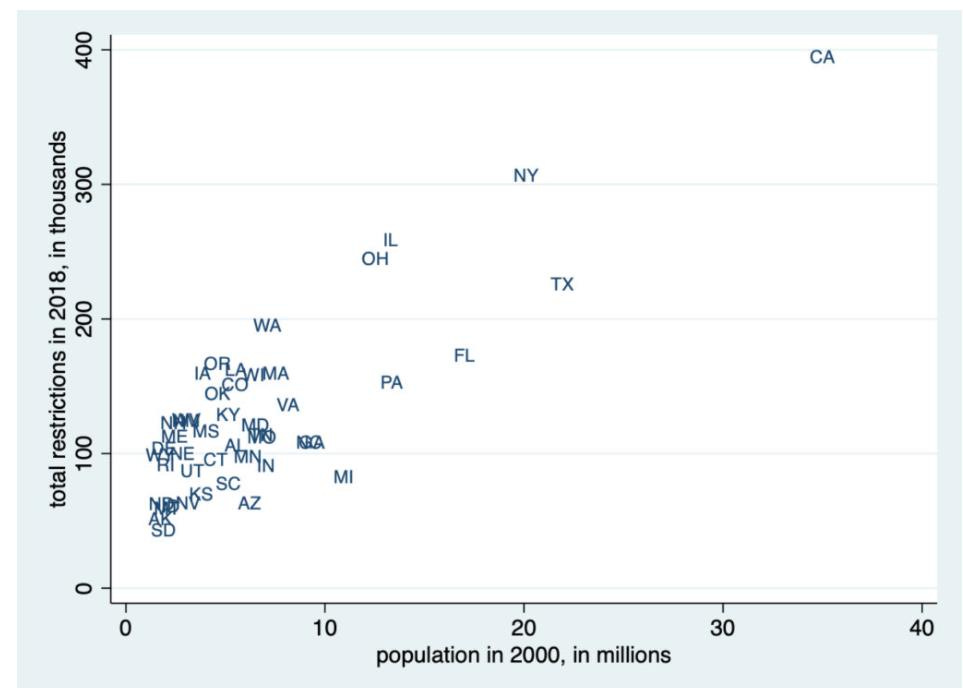
Regulations increase with population. Researchers have found that “across states, a doubling of population size is associated with a 22 to 33 percent increase in regulation. The relationship between regulation and population is surprisingly robust- it also holds for Australian states and Canadian provinces, and based on the limited data we have seems to hold across countries too (for instance, the ‘free market’ United States has 10 times as many regulations as Canada- just as it has 10 times the population).”
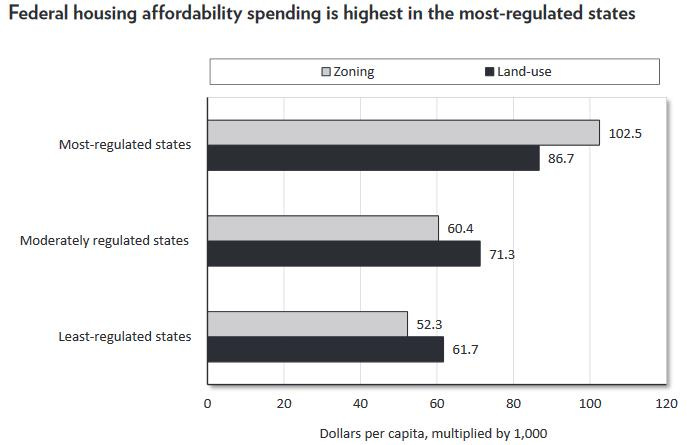
Increases in land use regulations are also correlated with higher federal costs for low-income housing.
Due to high housing costs in urban areas, minority borrowers have disproportionally fallen behind on housing payments as evidenced by the Consumer Financial Protection Bureau’s chart on the share of households behind on housing payments by race and ethnicity.
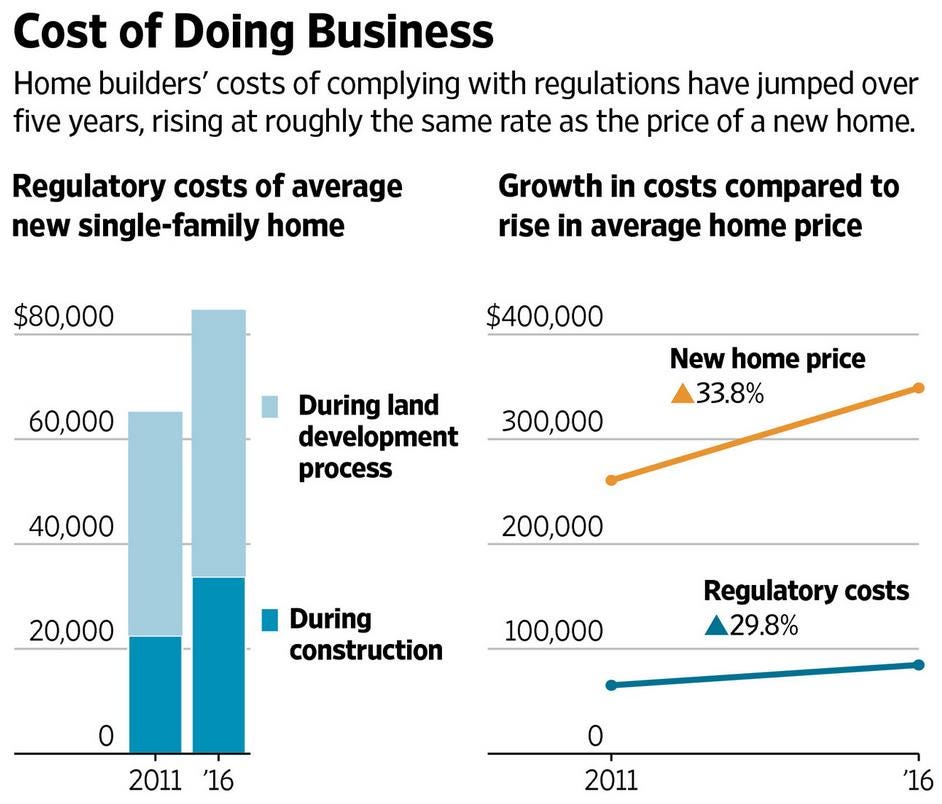
Housing prices have also risen at about the same rate as regulatory compliance costs.
While there’s a higher education degree gap between rural and urban areas, rural areas have median income, homeownership, and unemployment rates comparable to or better than those in urban areas.
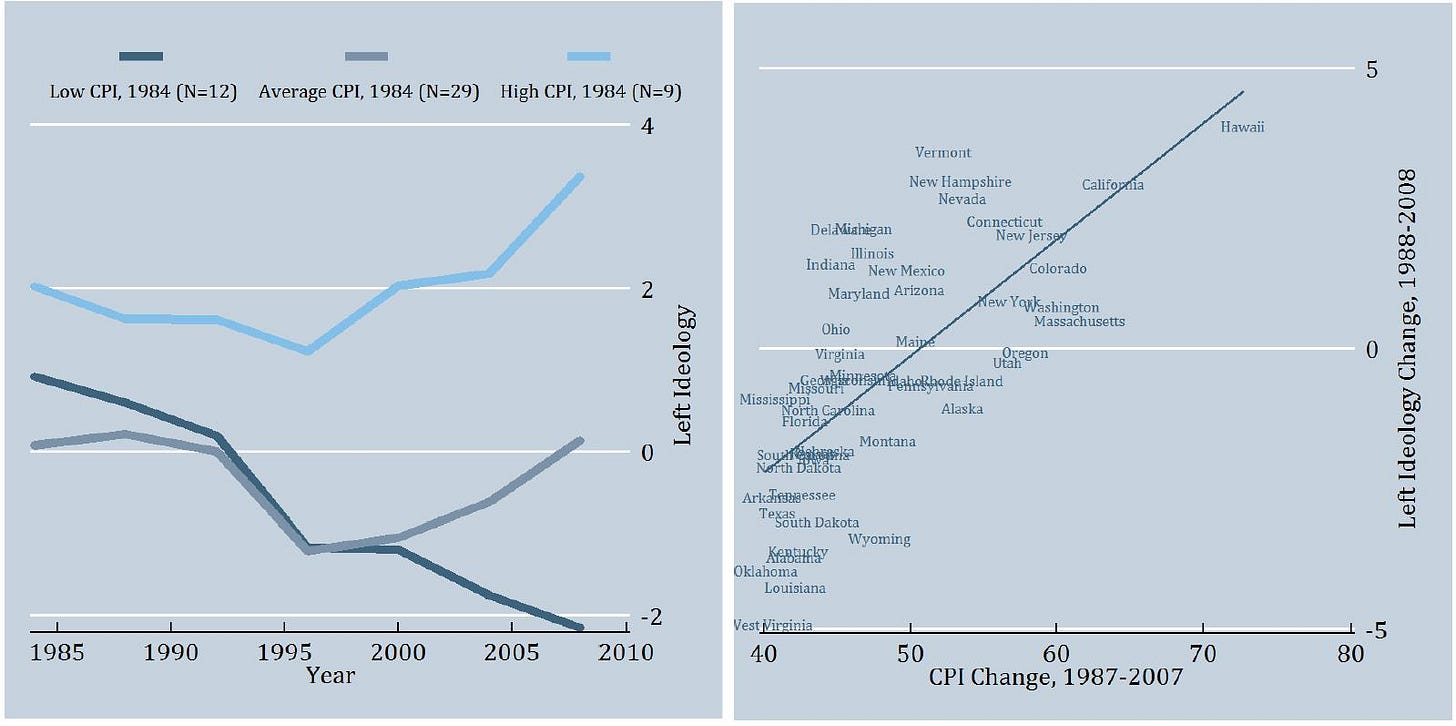
Researchers have found that Republicans tend to move to lower-cost states, while Democrats tend to live in more populated areas with higher costs of living, based on the Consumer Price Index (CPI).
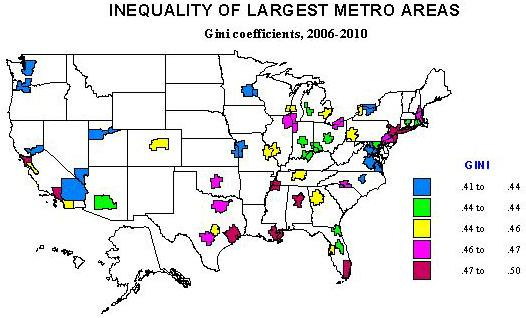
The most pronounced economic inequality also occurs in America’s biggest cities.
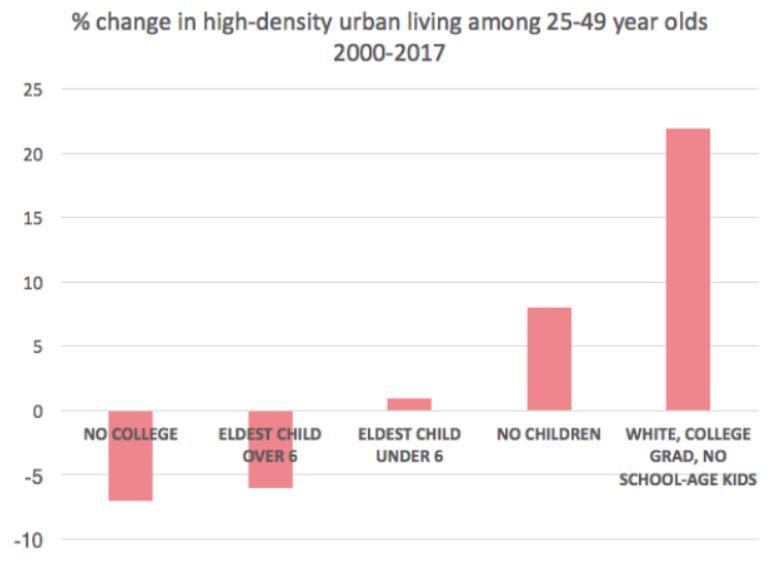
The high cost of housing and living in urban areas has led to a dearth of families with children in urban areas. As has been reported: “In high-density cities like San Francisco, Seattle, and Washington, D.C., no group is growing faster than rich college-educated whites without children, according to Census analysis by the economist Jed Kolko. By contrast, families with children older than 6 are in outright decline in these places. In the biggest picture, it turns out that America’s urban rebirth is missing a key element: births.”
High urban housing costs also eat away at any college wage premiums college-educated people might enjoy. Enrico Moretti (2013) estimates that 25% of the increase in the college wage premium between 1980 and 2000 was absorbed by higher housing costs. Moreover, since the big increases in housing costs have come after 2000, it’s very likely that an even larger share of the college wage premium today is being eaten by housing. High housing costs don’t simply redistribute wealth from workers to landowners.
As Joel Kotkin has summarized:
The regions with the deepest declines in housing affordability, notes William Fischel, an economist at Dartmouth College, tend to employ stringent land-use regulations, a notion recently seconded by Jason Furman, chairman of President Obama’s Council of Economic Advisors … The bluer the city, generally, the fewer the children. For example, the highest percentage of U.S. women over age 40 without children -- a remarkable 70 percent -- can be found in Washington, D.C. In Manhattan, singles make up half of all households. In some central neighborhoods of major metropolitan areas such as New York, San Francisco, and Seattle, less than 10 percent of the population is made up of children under 18. Perhaps the ultimate primary example of the new child-free city is San Francisco, home now to 80,000 more dogs than children, and where the percentage of children has dropped 40 percent since 1970 … High housing prices tend to stunt upward mobility, particularly for minorities. One reason: The house remains the last great asset of the middle class. Homes represent only 9.4 percent of the wealth of the top 1 percent, but 30 percent for those in the upper 20 percent and, for the 60 percent of the population in the middle, roughly 60 percent. The decline in property ownership threatens to turn much of the middle class into a class of rental serfs, effectively wiping out the social gains of the past half-century.
First-time mothers are older in big cities and on the coasts, and younger in rural areas and in the Great Plains and the South.
Over time, people have also tended to move to parts of the country that share their values. At least since the 1970’s, Americans have been better able to move to districts and states that contain more politically like-minded potential spouses and friends, and have done so, explaining differences in voting patterns between rural and urban congressional districts. As researchers have pointed out, “In 1976, 26.8% of Americans lived in counties in which the presidential vote margin was at least 20%; by 2000, that number had increased to 48.3% … [O]n average those choosing to remain in rural areas are likely to be different in a variety of ways from those eager to move to the cities.”
As a result, in Congress, House Members and Senators have tended to vote much more along party lines since the 1970’s, as their districts have become populated with more like-minded constituents.
As Samuel Abrams and Joel Kotkin write:
[T]he geographic divisions in the country – what some call “the big sort”– [occurred] as Americans increasingly settle[d] into distinct communities of likeminded individuals. Urban centers, for example, are particularly friendly to singles. In virtually all high-income societies, high density today almost always translates into low fertility rates, led by San Francisco, Los Angeles, Austin, and Boston. In urban cores like Manhattan, single households constituted nearly 50% of households, according to American Community Survey 2019 data. And with many businesses and cultural opportunities moving away from cities and diffusing and becoming more diverse and family friendly with varied amenities, the polarization between cities and their narrowly left residents and the rest of the nation may increase. According to the recent AEI data, even married women in the Northeast are conservative. This gap, unsurprisingly, widens in the South and Midwest. But the major divides are in terms of type of community. Married women who live in urban settings are evenly split between conservative and liberal, but among single women, just 18% are conservative with 44% liberal (the rest identify as moderate or refused to say). In the suburbs, the key political battleground, 35% of married women are conservative and 22% liberal. For unmarried women, 23% are conservative and 34% are liberal. In rural areas, 42% of married women are conservative compared to 14% liberal while single women divide evenly. Unlike the wave of immigrants or rural migrants who flooded the American metropolises of the early 20th century, urbanites today generally avoid raising large families in cramped and exceedingly expensive spaces. According to analysis by demographer Wendell Cox, households in suburbs and exurbs are roughly four times more likely to have children in their household than residents of the urban core. The lowest birthrates are found in ultra-blue cities and states, magnets largely for singles and the childless. Six years ago the New York Times ran a story headlined “San Francisco Asks: Where Have All the Children Gone?” and stories abound about the Golden Gate City having the fewest children of all major American cities. Many other major cities lost families with children during the pandemic. Between 2020 and 2021, Manhattan saw a whopping 9.5% decline in the number of children under 5 – and many families are not returning. Some of this reflects policies associated with driving housing prices up more than elsewhere. Like other blue states, California has adopted policies that discourage single family housing favored by married couples with children in favor of dense, usually small urban apartments. Given the political orientation of single women, urban areas can be expected to go further left, while the suburbs, and particularly the exurbs, with their concentrations of married families, will likely shift towards the center and right.
More recently, however, U.S. internal migration has gone down, as the increased expense of living in urban areas discourages moves to those areas even when they might otherwise provide for more economic opportunities.
Younger people are not moving to cities like they used to. As urban researcher Joel Kotkin has written:
[A]s a new Brookings study shows, millennials are not moving en masse to metros with dense big cities, but away from them. According to demographer Bill Frey, the 2013–2017 American Community Survey shows that New York now suffers the largest net annual outmigration of post-college millennials (ages 25–34) of any metro area -- some 38,000 annually -- followed by Los Angeles, Chicago, and San Diego. New York’s losses are 75 percent higher than during the previous five-year period. By contrast, the biggest winner is Houston, a metro area that many planners and urban theorists regard with contempt. The Bayou City gained nearly 15,000 millennials net last year, while other big gainers included Dallas–Fort Worth and Austin, which gained 12,700 and 9,000, respectively. Last year, according to a Texas realtors report, a net 22,000 Californians moved to the Lone Star State. The other top metros for millennials were Charlotte, Phoenix, and Nashville, as well as four relatively expensive areas: Seattle, Denver, Portland, and Riverside–San Bernardino. The top 20 magnets include Midwest locales such as Minneapolis–St. Paul, Columbus, and Kansas City, all areas where average house prices, adjusted for incomes, are half or less than those in California, and at least one-third less than in New York.
Samuel Abrams adds that:
While city leaders, pundits, and various urban stakeholders alike want younger cohorts of Americans to return to cities, survey research has repeatedly documented that these critically important younger Americans actually show greater interest in suburban life than dense city living, though this fact is not being treated as seriously as it should. Thanks to YouGov, we have more data on attitudes about cities from younger cohorts and now know that despite oft-cited virtues of public transit and lower congestion rates, positive environmental impacts, and purportedly lower crime levels, younger Americans are not sold on high-density city living. Specifically, YouGov asked a national sample of adults whether they believe it is better for the environment if houses are built closer together or farther apart. Three-quarters (75 percent) of all Americans agreed with the statement that building homes farther apart is better for the environment. While the rationales for this conclusion were not asked, they could be everything from seeing the importance of more trees and green spaces to perceptions of high energy costs for big city buildings. Going deeper, the data reveal that majorities of Americans of various age cohorts all agree that space between homes is important: Roughly six in 10 (58 percent) Americans between ages 18 and 29 feel this way, and an even higher 83 percent of their parents’ cohort (Americans ages 45 to 64) agree. Although older Americans are more likely to believe that extra space is better for the environment, significant numbers of younger Americans also feel the same way. In this new, post-pandemic era, it should not be assumed that younger Americans are excited by or are willing to live in cramped apartments just to be in urban cores today, as the majority of adult Americans under 30 believe that having space is of value. As for the question of density and traffic—a known source of pollution and stress—majorities of all age groups agree with the statement that higher-density development creates more traffic since people are living closer together. Only a handful of points separate the surveyed age groups, with roughly six in 10 Americans ages 65 and older (63 percent), ages 30 to 44 (56 percent), and ages 18 to 29 (57 percent) all agreeing that high-density development leads to congestion. Before the pandemic, the Texas A&M Transportation Institute found that drivers in the 15 most congested cities spent an average of 83 hours a year stuck in traffic. In Los Angeles, the most congested metro area, stalled traffic costs commuters a whopping 119 hours a year on average. It is no wonder so many want lower-density areas, and younger Americans are no different than anyone else here. Turning to the question of crime—which is spiking in dense cities like San Francisco and New York and has become a significant political question, inhibitor of economic development, and safety problem—a majority (53 percent) of younger Americans believe that compared to less densely populated areas, high-density areas have higher crime rates. And just 17 percent think that dense areas have lower crime rates. This is less extreme than their parents’ cohort, of whom two-thirds (67 percent) think that density promotes higher crime rates. Even so, it is simply not the case that younger Americans have diametrically opposing views on crime and urbanity compared to their parents or grandparents, and they may be far less willing to accept the tradeoff of habitual petty crimes or violent crimes on public transit subways just to live in city centers.
High crime rates in urban areas result in a lack of wider economic opportunity there. As Charles Murray writes in Facing Reality:
In big-city America, disproportionate minority crime rates raise the costs of doing business for retailers of all kinds. It is often alleged that large commercial chains avoid putting stores in minority neighborhoods. The empirical part of the allegation is sometimes true, but the inference that racism is to blame does not follow. Shoplifting is far more common in many big-city minority neighborhoods than elsewhere. It often doesn’t make economic sense for big chain stores, which have business models based on low profit margins, to locate in such neighborhoods. Either they won’t make a profit or they will have to charge higher prices, leaving themselves open to accusations of racist price gouging. If they take measures to apprehend shoplifters, they risk charges of racism and financial shakedowns through the threat of lawsuits. Actions taken to prevent shoplifting can also put employees at risk of violent confrontations. It’s a no-win situation. Opening a store in a big-city minority neighborhood is often not economically rational. Racism need not have anything to do with the decision. Meanwhile, the small locally owned retailers in a big-city minority neighborhood also have a hard time making a profit because of shoplifting, the threat of robbery, high insurance costs, and banks’ reluctance to make high-risk loans. The locally owned stores tend to be poorly stocked, with few amenities, and overpriced relative to stores selling the same goods elsewhere.
Jonathan Rodden, in his book Why Cities Lose, describes the early history of the rural and urban divide. The urban association with Democratic voting started with the socialist worker proposals after the Industrial Revolution and into the era of industrial manufacturing. When manufacturing jobs moved to the South, the dense worker housing built in the former manufacturing districts became used predominantly by the poor and unskilled immigrants who generally supported New Deal and Great Society programs, constituencies that remain to this day. As explained by Rodden:
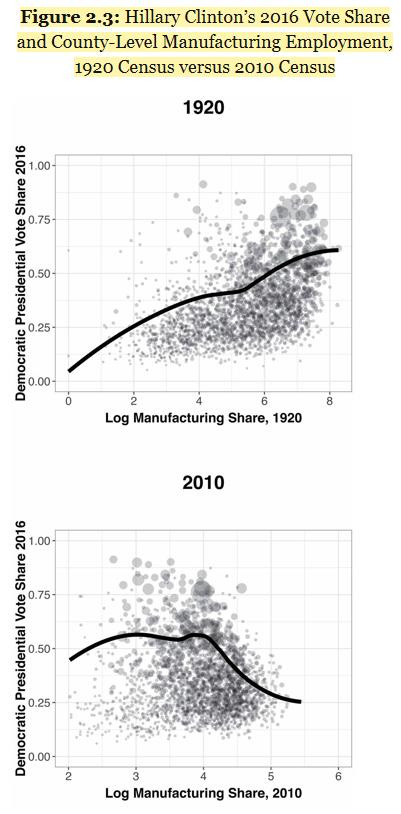
Figure 2.3 plots Hillary Clinton’s share of the two-party vote in the 2016 presidential election on the vertical axis, against the share of the population employed in manufacturing on the horizontal axis. The top graph looks at manufacturing levels in the 1920 census—right around the apex of the golden age of American manufacturing—and the bottom graph looks at manufacturing levels today. Again, the size of the data markers corresponds to the size of the county. The overall relationship is captured by the solid line. The top graph, using the 1920 census data, reveals that to a striking extent, today’s Democratic voting is correlated with manufacturing employment almost one hundred years ago. The bottom graph, using data from the 2010 census, reveals a stunning transformation. While historical manufacturing is correlated with modern Democratic voting, contemporary manufacturing is correlated with modern Republican voting. This correlation between contemporary manufacturing and Republican voting did not emerge in 2016. In fact, the county-level association between contemporaneous manufacturing and Democratic voting had started to break down in the 1960s, and it was gone by the Reagan era. In the New Deal era, the average manufacturing worker was employed in a very large firm in a large urban center, where labor relations were strained and support for the right to strike was an important part of the Democrats’ appeal. Today, the average manufacturing worker is employed in a vastly smaller firm well outside the city center, where strikes are a foreign concept, and labor unions are only for schoolteachers and municipal employees. Today, the Democrats are the party of urban, postindustrial America, and the Republicans receive more votes in exurban and rural places where manufacturing activity still takes place.
While manufacturing jobs were lost in many districts along waterways and railroads, and unionization in the private sector subsequently fell in those districts, unions refocused their efforts in those districts in the public sector, where they came to dominate school districts, city councils, and the public, governments sectors generally, which came to employ proportionately more people in those districts.
By the early 2000’s, rural voters’ favoring Republicans, and urban voters’ favoring Democrats, had proven consistent over time.
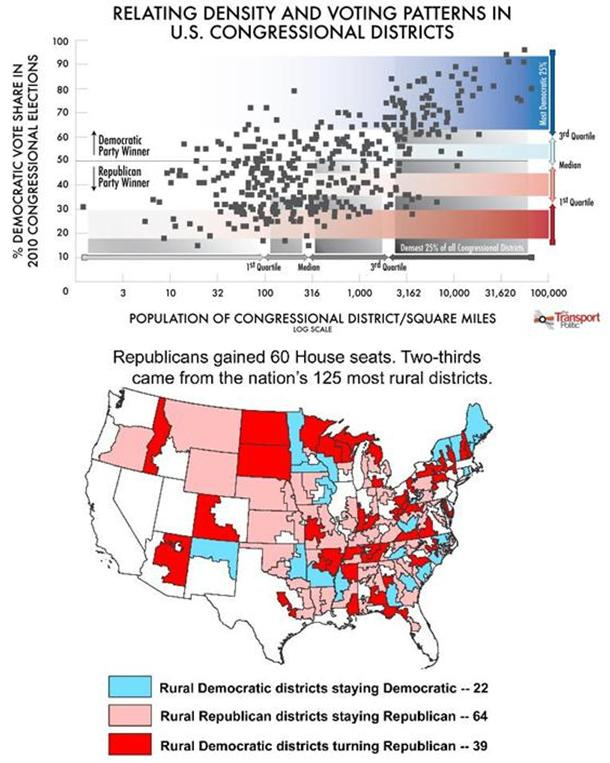
In the 2010 election, two-thirds of the seats Republicans retook represented rural areas.
The following chart shows which 2012 Presidential candidate won, and by how much, in areas of increasing population density.
In the 2016 presidential election, there was an even greater divergence in the voting patterns of rural and urban voters.
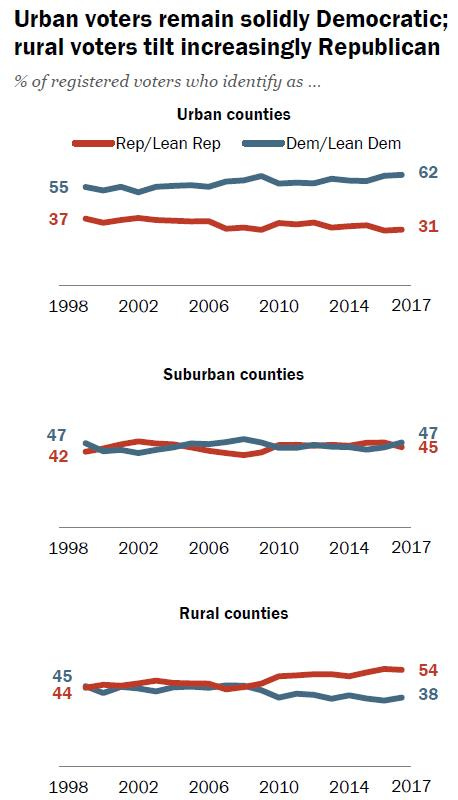
A 2018 Pew study shows that residents of rural areas are increasingly more likely to be Republicans, and urban residents are more likely to want to move to rural areas if they could.
Graphical displays of large vote margins for Democrats in urban areas in presidential election years show how counties with large urban areas overwhelmingly favor Democratic candidates (in this case, President Obama in 2012) whereas the rest of the country generally does not. (The chart uses bar graphs to indicate the size of each candidate’s margin of victory in each county.)
A similar graph shows how support for the Democratic candidate in the 2016 presidential election came predominantly from cities.
(Following the 2018 midterm Congressional elections, Democrats held about 53.6% of seats. Democratic House candidates nationwide had 52.8% of the votes cast. The Democrats’ popular vote edge was inflated by more than three dozen districts nationwide that had no Republican candidate on the ballot. By contrast, only a few GOP candidates were running unchallenged. Following the 2018 midterms, Democrats were likely better represented in the House than they would be if House membership were chosen by a nationwide generic ballot.)
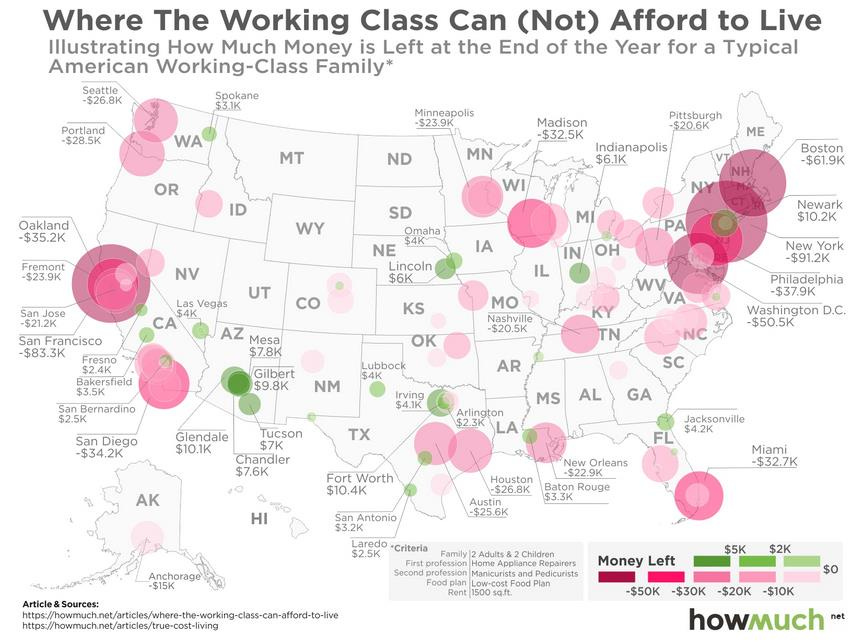
The areas of the raised blue bars in the maps above correspond with the large red dots in the following map, which shows where working class people generally cannot afford to live. A detailed precinct-by-precinct 2016 presidential election map can be found here.
Another factor at work in the generally large, disproportionate share of the vote Democrats receive in urban areas is the propensity toward “groupthink” in areas that have come to have virtually no diversity of viewpoints. Even within geographic areas, people tend to interact mostly with people they agree with politically, especially Democrats in densely populated urban areas. Researchers have found that:
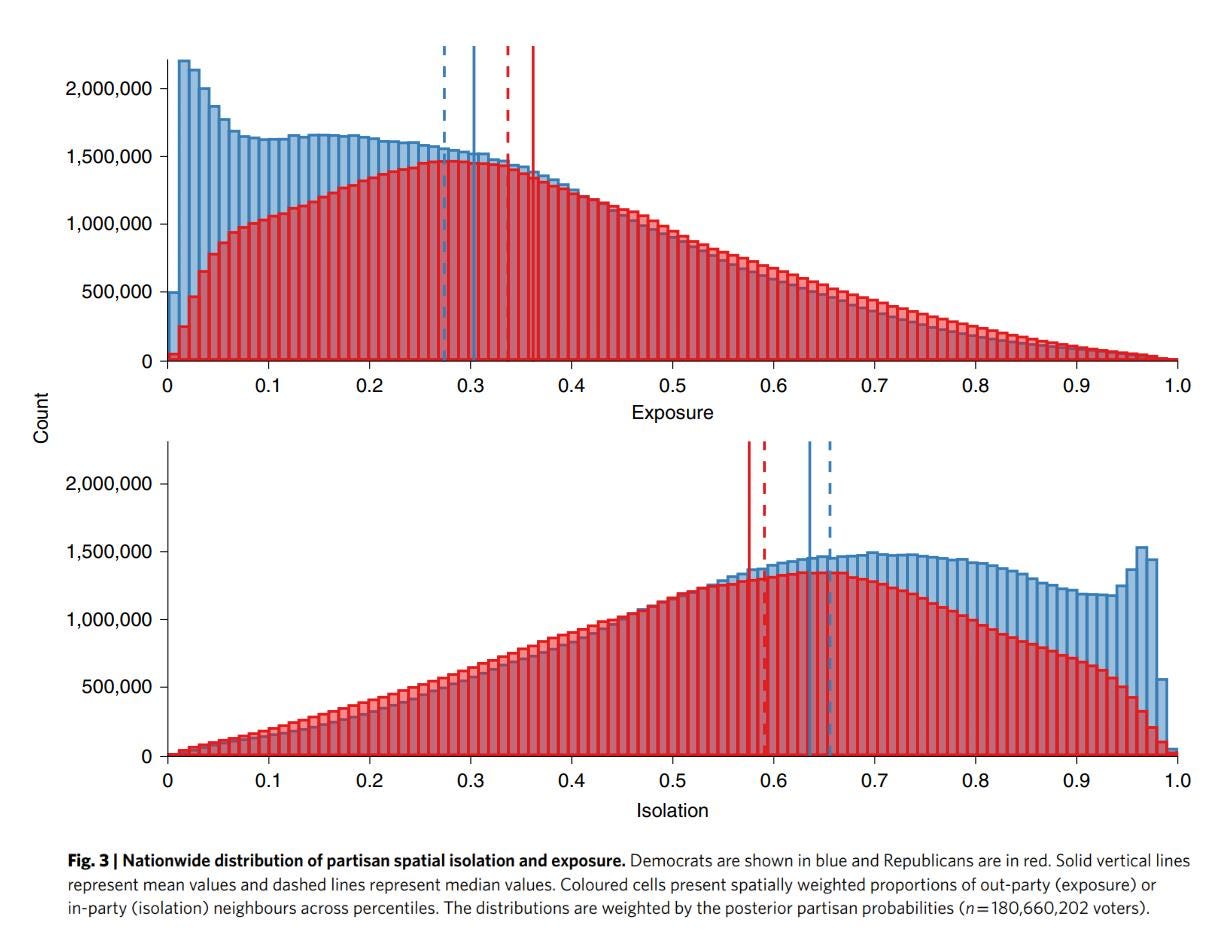
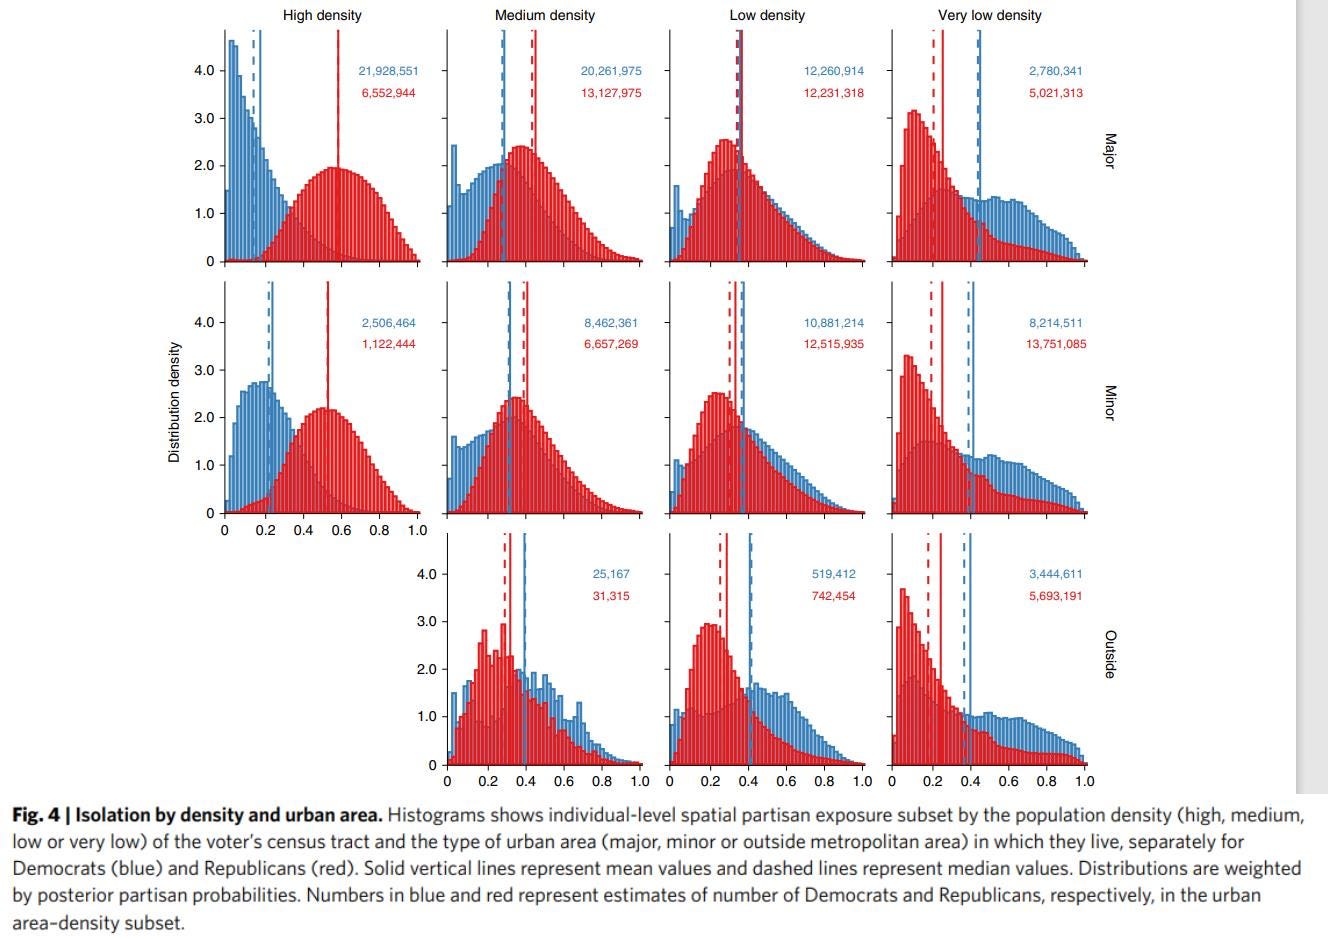
[U]sing advances in spatial data computation, we measure individual partisan segregation by calculating the local residential segregation of every registered voter in the United States, creating a spatially weighted measure for more than 180 million individuals. With these data, we present evidence of extensive partisan segregation in the country. A large proportion of voters live with virtually no exposure to voters from the other party in their residential environment. Such high levels of partisan isolation can be found across a range of places and densities and are distinct from racial and ethnic segregation. Moreover, Democrats and Republicans living in the same city, or even the same neighbourhood, are segregated by party … A large proportion of US voters live with very low levels of residential exposure to neighbours from the other party. The most extreme political isolation is found among Democrats living in high-density urban areas, with the most isolated 10% of Democrats in the United States expected to have 93% or more of encounters in their residential environment with other Democrats.
The researchers continue: “Moreover, the national distribution (Fig. 3) shows a large portion of voters living in extreme isolation; nationwide, 10% of Democrats live with virtually no exposure to out-partisan neighbours (exposure < 0.05) …”
Still, the 2024 presidential election showed a shift toward the Republican candidate in urban areas as well. As Reihan Salam and Charles Fain Lehman write:
In fact, Trump most overperformed in large metro counties, according to analyst Jed Kolko. Compared with his run against Joe Biden, Trump ran 9 points closer to Kamala Harris in such areas—a bigger gain than he saw in suburbs, college towns, or military posts. It wasn’t just a few cities, either. Trump improved on his 2020 performance in cities as diverse as Chicago, Detroit, and Dallas. He won Miami-Dade County outright. He got the closest margin for a Republican in New York City in 30 years. He won a precinct in lower Manhattan; one south Philadelphia neighborhood voted for him by almost three to one.
That concludes this essay series on political trends over the last quarter-century. The next series of essays will explore what people think of capitalism today, and how puzzling it is that there isn’t more support for it, given its results since the Industrial Revolution.


