Politics Over the Last Couple of Decades – Part 4
Ideological associations between marriage and fertility.
In this essay, we’ll explore ideological associations between marriage and fertility.
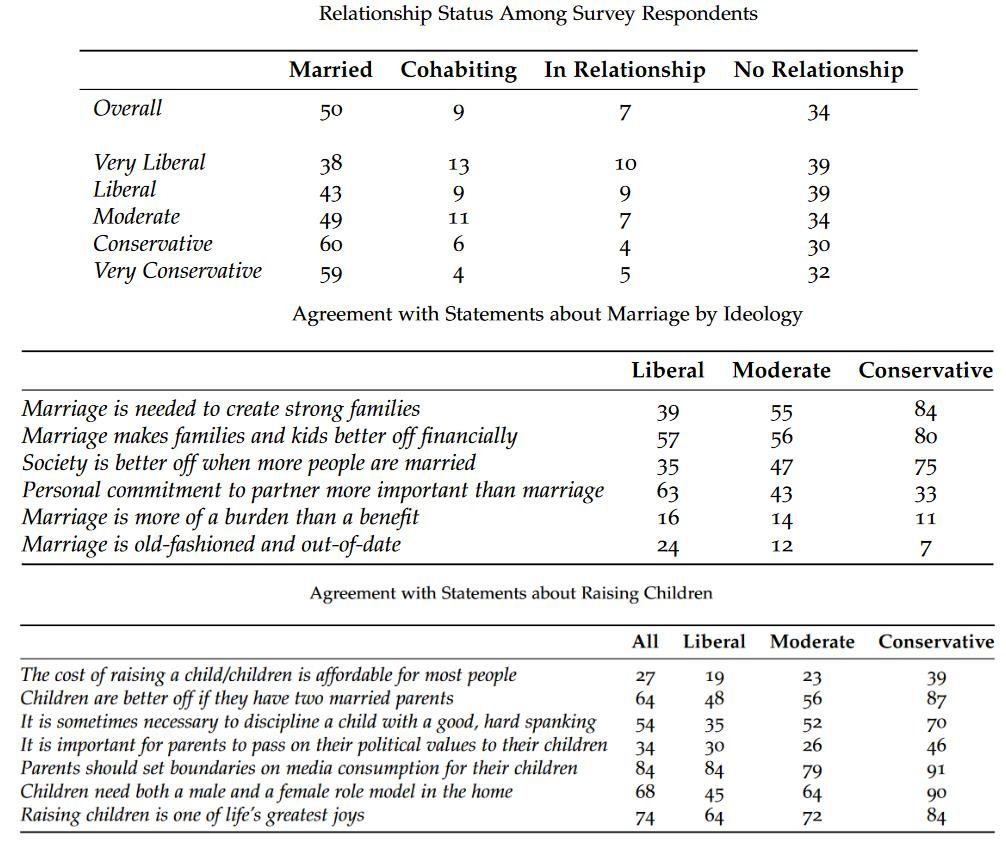
Regarding general attitudes about marriage, researchers have found that self-identified conservatives and liberals have different marriage rates, and different attitudes toward marriage and family, with conservatives disproportionately being married and believing “marriage is needed to create strong families” and “marriage makes families and kids better off financially.”
Researchers have found that adults who choose not to have children tend to have liberal political views:
[C]hildfree individuals [people who choose not to have children] were more liberal than parents … The fact that we were unable to identify significance differences in personality traits between childfree individuals and parents suggests that the decision to be childfree is not driven by individual personality traits, but instead may be driven by other individual (e.g., political ideology) or situational (e.g., economic) factors. Indeed, we did find that childfree individuals were significantly more liberal than parents, even after controlling for demographic characteristics.
Regarding reasons people give for having or not having kids, Pew published research examining why young adults say they’re “unlikely” to have kids. Top answers include prioritizing careers and hobbies, insufficient funds, concerns about the state of the world, and climate change. But the number-one reason, particularly among women: they “just don’t want to.” Pew also found that between 2018 and 2023, the share of U.S. adults under 50 who say they are “unlikely to ever have kids” rose 10 percentage points, from 37 percent to 47 percent.
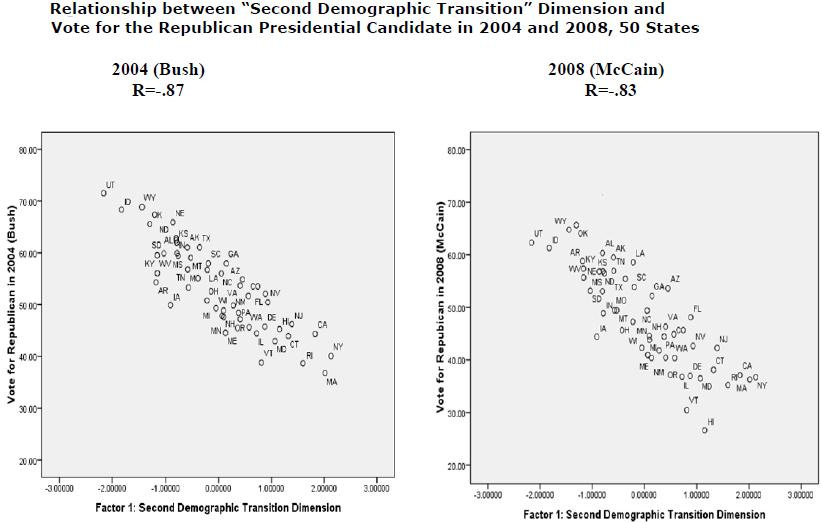
Going back to the early 2000’s, one analysis grouped states by their prevalence of indicators such as the postponement of marriage, greater prevalence of cohabitation, postponement of parenthood, sub-replacement fertility, and a higher incidence of abortion (indicators called the “Second Demographic Transition Dimension”). Results showed that voters in states with more of those indicators (right side of x-axis) tended to vote for the Democratic presidential candidate (bottom of y-axis).
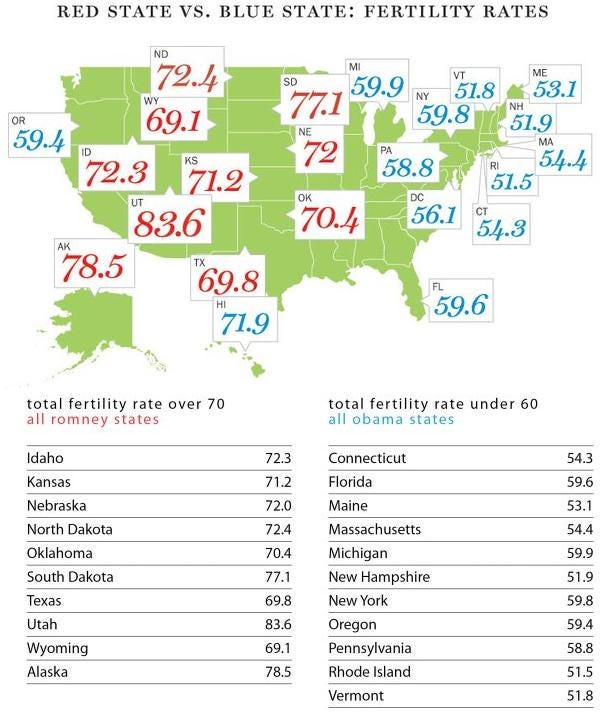
As of 2012, state fertility rates tended to correlate with presidential election voting patterns, with lower fertility states tending to vote for Democratic Party (blue state) candidates. An exceptional state like California (with a relatively high fertility rate, but voting Democratic) has the largest foreign-born Hispanic population (27 percent), a population with a higher fertility rate.
By 2016, when one looked at counties in the United States, one would see that counties that lean Republican across the country as a whole have more marriage, less nonmarital childbearing, and more family stability than counties that lean Democratic. An Institute for Family Studies report found that “teens in red counties are more likely to be living with their biological parents, compared to children living in bluer counties.” At the individual level, Republicans are more likely to be married, and happily married, than independents and Democrats, as shown in a research brief for the Institute for Family Studies. They are also less likely to cheat on their spouses and less likely to be divorced, compared with independents and Democrats.
By 2020, as W. Bradford Wilcox explains, married people continued to tend to vote Republican in the 2020 presidential election:
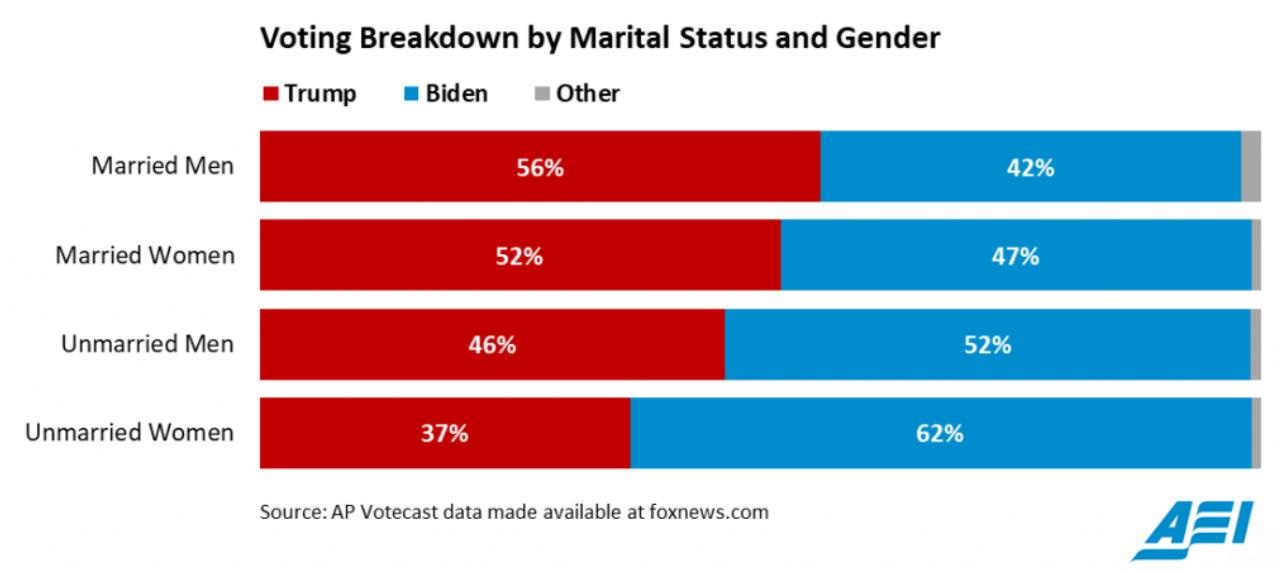
Our colleague Lyman Stone recently highlighted one aspect of this story: Families and communities with more children tend to vote red. But there is another key dimension: Marriage continues to shape U.S. elections. This past November, married Americans and communities with more married men and women were markedly more likely to vote Republican. A cursory look at 2020 election polling data reveals a sharp divide between married and unmarried adults. The AP VoteCast (a massive online poll fielded in the days just before the election) suggests Donald Trump received a comfortable majority of votes among married men and women (54 percent).
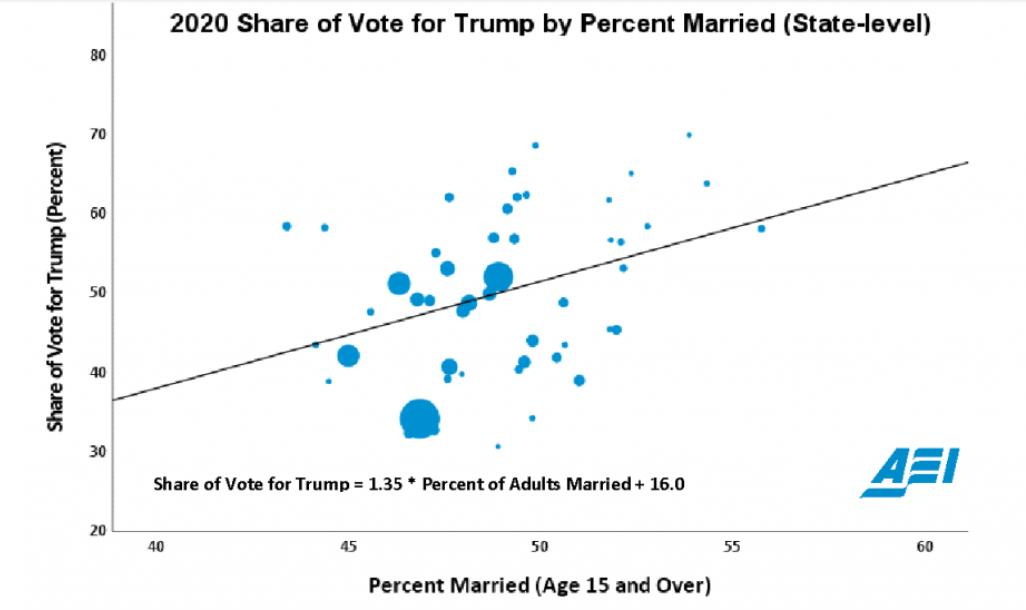
Polling data also suggest that Trump gained ground among married women in 2020. According to the National Exit Poll, Hillary Clinton won 49 percent of votes from married women in 2016, compared to Trump’s 47 percent. In comparison, the AP VoteCast suggests Trump won a majority of votes from married women in 2020 (52 percent compared to Biden’s 47 percent). But polls and exit polls are notoriously unreliable and conclusions on voting behavior should consider additional data sources. Here, we use the latest 2020 election returns at the state and county levels to suggest marriage heavily influenced 2020 voting decisions. As shown in the chart below, states with a higher share of married adults cast a greater share of their vote for President Trump in 2020 compared to states with a lower share of married adults.
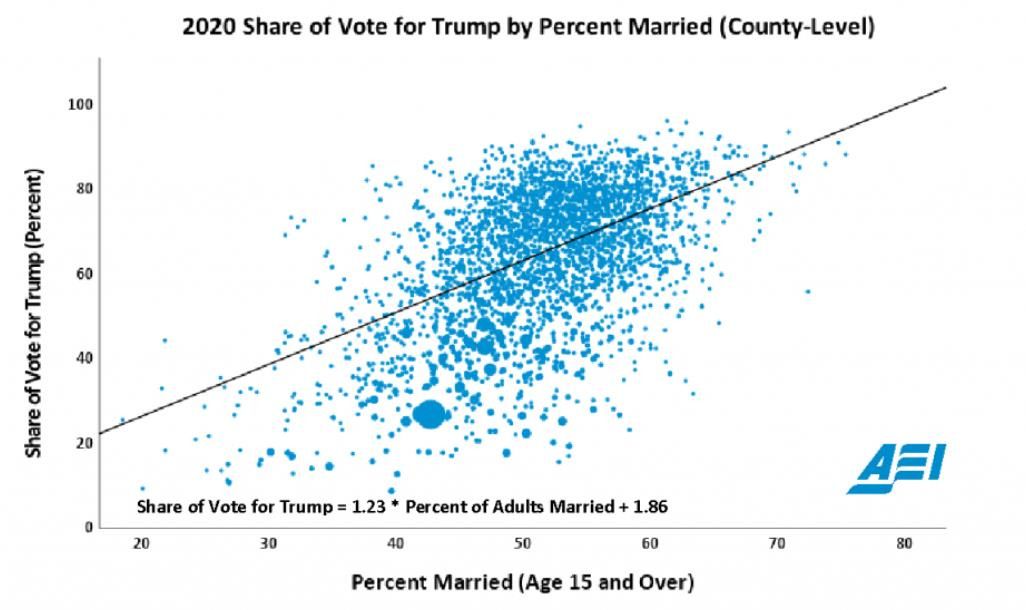
State-level trends, however, are not granular enough to draw strong conclusions. The chart below plots county-level votes for President Trump versus the share of a county’s residents over age 14 who were married according to the 2014–2018 American Community Survey. We find a strong association between marriage and voting Republican. In fact, a 1 percentage point increase in marriage was generally associated with a 1.2 percentage point increase in Trump’s share of the vote. To get a sense for how marriage stacks up against other demographic variables, we ran a multivariate regression. We believe that marriage is the strongest predictor of 2020 votes, when stacked against other demographic data such as race, ethnicity, income, education, and population size.
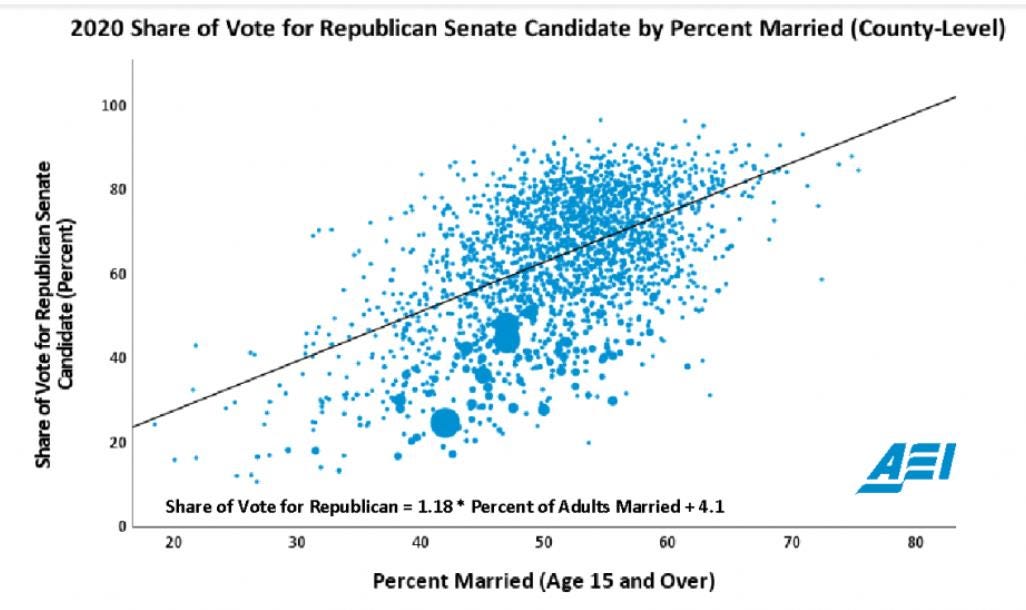
This trend is not just isolated to voting patterns for Trump. We identify a similarly strong relationship between marriage and voting behavior in senate elections. For senate campaigns, too, marriage is up and away the strongest predictor of counties voting Republican.
It also appears this association might have strengthened slightly since 2016. A multivariate regression looking at the county-level vote swing between 2016 and 2020 shows a modest but statistically significant association between higher levels of marriage and an increase in Trump’s vote share.
As Lyman Stone notes, in the 2020 presidential election, the fertility rate in various counties correlated with a preference for Trump or Biden. He states:
In this [2020 presidential] election, the association between fertility rates and voting patterns was crystal clear. The figure below shows the share of a county’s vote won by President Trump vs. the total fertility rate for that county from 2016 to 2019, the latest available data.
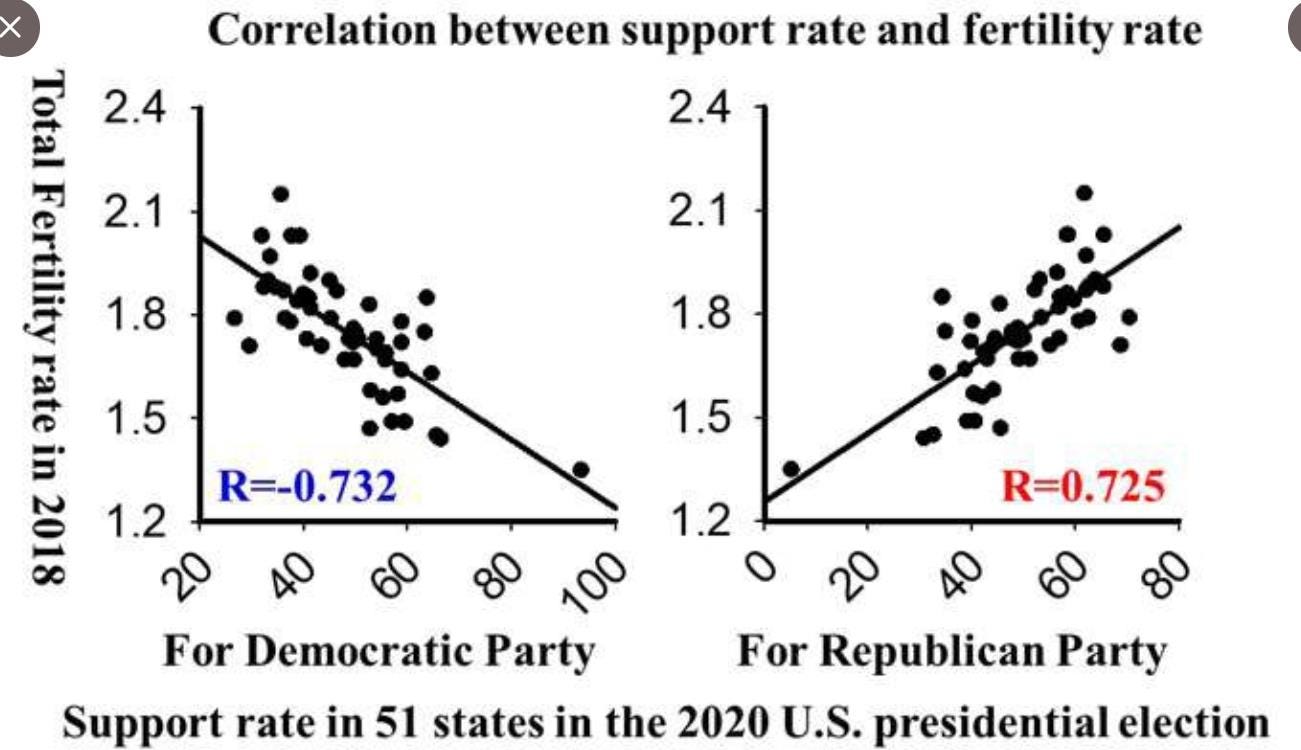
Data about fertility rates is only available for around 600 of the largest counties, thus many small, rural counties are excluded. But the relationship shown here is clear: President Trump did better in counties with higher birth rates, and the difference is fairly large, with the most pro-Biden counties having total fertility rates almost 25% lower than the most pro-Trump counties. If anything, this effect is understated, since the most pro-Trump counties were small, rural counties that usually have even higher birth rates and are excluded from this analysis. Indeed, Yi Fuxian at the University of Wisconsin showed that the relationship between voting and fertility is even more pronounced when we look at fertility rates and state voting trends.
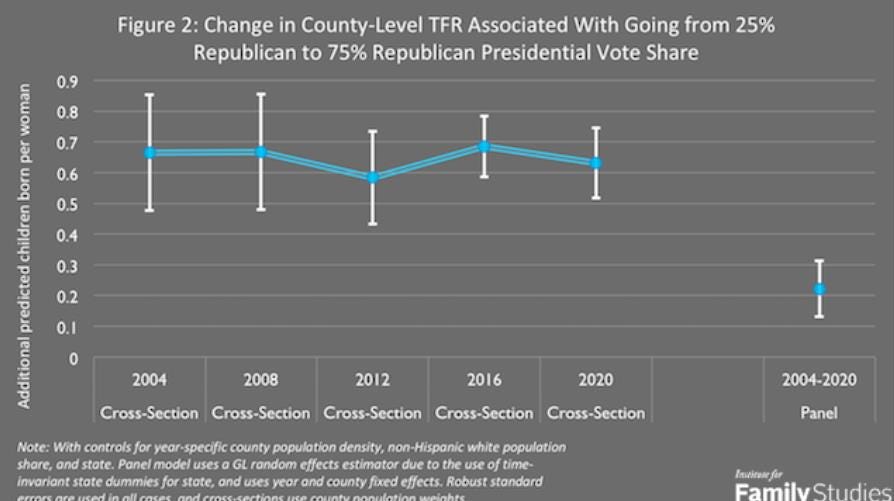
Nor is the relationship between fertility and presidential voting a spurious result related to urbanization, race, or state practices in drawing county lines. The figure below extends the analysis to more presidential elections, and includes controls for the state a county is in, the county’s non-Hispanic white population share, and the county’s population density.
As can be seen, the Republican fertility advantage is relatively stable across elections. It even shows up in a panel model, suggesting that as counties become more Republican, their fertility rates tend to rise relative to the national average. The use of state controls (and some robustness tests I ran in large states with many counties) suggests this effect isn’t driven by unique features of states: within Red states or Blue states, and controlling for county racial and ethnic characteristics and population densities, Republican counties have higher birth rates … [D]ata from the General Social Survey can be used to provide a more granular understanding of the ideological fertility difference. The figure below shows the number of children ever born to women sampled in the GSS who were over age 44, and women ages 30-44, by political ideology.
In the 1970s, there was little or no difference in fertility rates between liberal and conservative women. But by the 2000s, completed fertility for liberal women had declined markedly below that of conservative women. In recent years, the gap in childbearing between young conservative and liberal women has really opened, which may portend a bigger gap in the coming years. This graph has no controls for other factors. But the figure below introduces control variables for women’s age, the year of the survey, women’s race or ethnicity, educational level, and marital status. It shows the difference between conservative and liberal women after all these variables are controlled for, with the period 1972-1994 lumped together as one group, and 1995-2018 lumped together as another group …
[C]onservatives are simply more likely to be married than liberals. Thus, there is a conservative-liberal gap on marriage and separately on odds of childbearing conditional upon marital status.
By 2022:
The exit poll in the almost even 2022 House (Republicans won the popular vote 50% to 47%) shows that married men voted 59% to 39% Republican, and unmarried men also went Republican by a smaller but significant 52% to 45% margin. Married women, however, also voted Republican by a landslide 56% to 42% margin. So, why was the election so close? Because unmarried women favored Democrats 68% to 31%. Note that married men and married women both made up 30% of the electorate. But there are a lot more unmarried women voters, 23% of the electorate, than unmarried men, 16%. That reflects not only longer female lifespans but also female dominance in higher education, with women making up 60% of college and university students these days, and the trend toward later first marriages. The upshot is that about one-third of Democratic voters are single women, which helps explain, as the Washington Examiner’s Conn Carroll points out, the 2012 Obama “Life of Julia” cartoons, which showed government helping unattached women through life.
Leading up to the 2024 presidential election:
According to the latest CDC data, the highest total fertility rates in 2023 were found in red states like South Dakota (2.01), Texas (1.81) and Utah (1.80). By contrast, blue states such as Vermont (1.30), Oregon (1.35) and California (1.48) lag well behind when it comes to childbearing. In fact, the top 10 states for fertility in 2023 were red states, and the bottom 10 states for fertility were blue states. So, while progressive commentators … celebrate blue-state policies like paid parental leave and free school lunches that are supposed to help families, it’s clear that families are voting with their feet — and their family planning decisions — for states without those policies.
And by 2024:
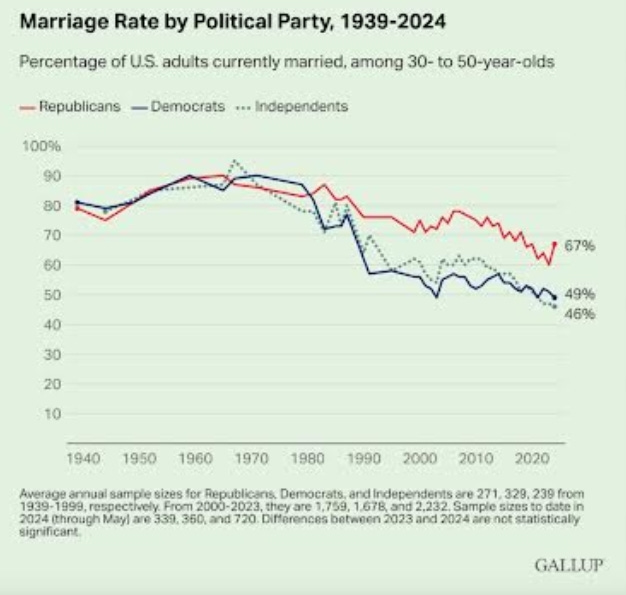
Today two-thirds of Republicans between the ages of 30 and 50 are married. Slightly less than half of Democrats in that age group are.
As Grant Bailey and Lyman Stone write in their report “The Trump Bump: The Republican Fertility Advantage in 2024,” conservatives are having more babies than liberals:
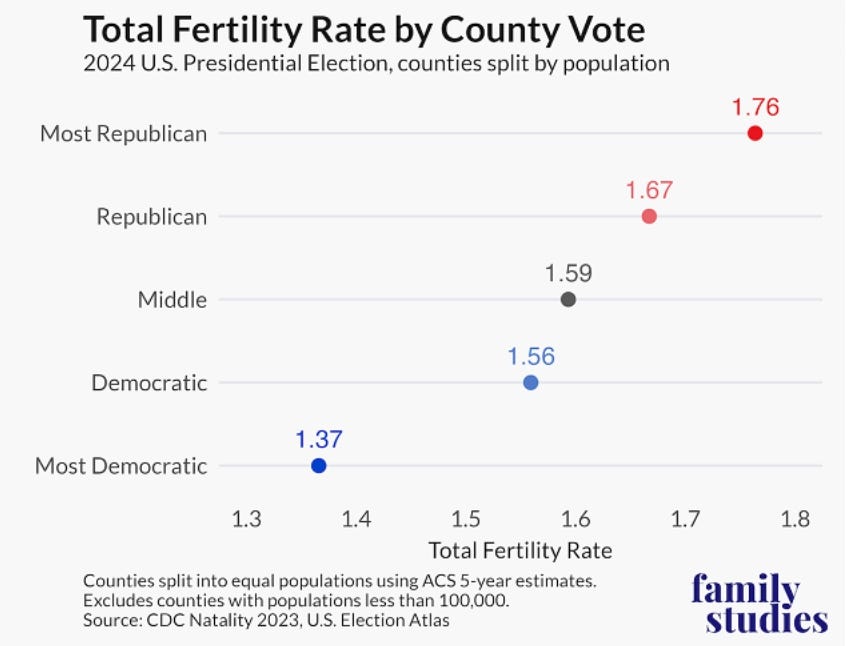
Those counties that voted for Trump tended to have much higher fertility rates than those that did not. This relationship is quite strong. For every 10% increase in votes for Trump in 2024, there is an expected increase of 0.09 babies in a woman’s lifetime. While 0.09 babies does not sound like much, the effect of this Republican advantage shows most prominently at the tail ends of county votes. Counties that had less than 25% of their vote share for Trump, such as D.C., had a median total fertility rate of 1.31. In contrast, counties that had more than 75% of their vote share for Trump had a median total fertility rate of 1.84. This relationship between voting Republican and having more babies is growing stronger over time. In 2012, a 10% increase in votes for Romney within a county saw an expected increase of 0.05 in the total fertility rate, compared to 0.09 in 2024. In the past 12 years, the geographic relationship between voting Republican and having more babies has grown by 85 percent … Essentially, the parties are divided by family … We get a clear picture of the fertility gap when we divide counties into five groups with equal population along partisan lines. The 20% most Republican counties have an aggregate total fertility rate of 1.76. The 20% most Democratic counties have an aggregate total fertility rate of 1.37, less than the [European Union] …
We get a clear picture of the fertility gap when we divide counties into five groups with equal population along partisan lines. The 20% most Republican counties have an aggregate total fertility rate of 1.76. The 20% most Democratic counties have an aggregate total fertility rate of 1.37, less than the EU.
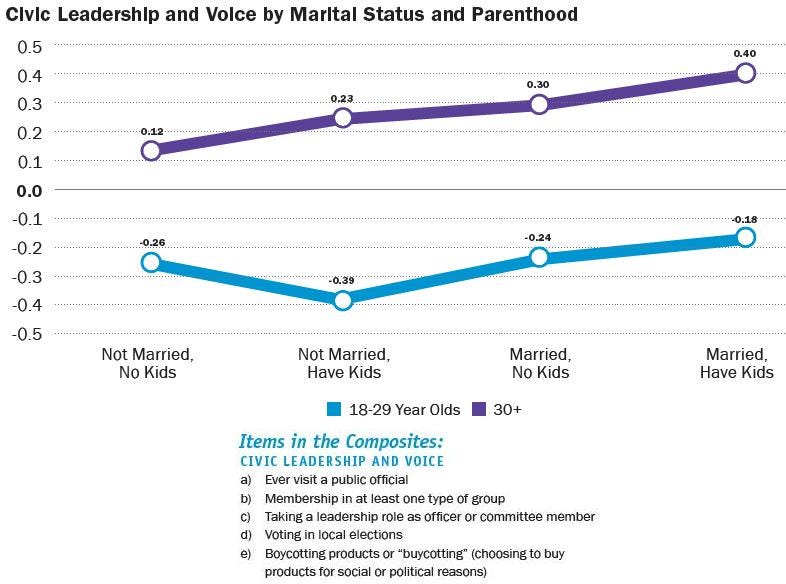
Being married and having children also increases civic involvement in local communities, regardless of age.
In the next essay in this series, we’ll examine ideological correlations with urban and rural areas.







Paul, Well this is fascinating. But none of this seems to address the chicken/egg question. You have thoughts?