In this series of essays, we’ll explore of the trends in politics over the last couple decades.
The results of the 2024 presidential election was presaged by a variety of metrics going back to the administration of Barack Obama.
Some significant metrics include federal spending and inflation.
Government spending has generally not lived up to its promises over the last two decades. Research has shown that “Most of the persistent increase in unemployment during the Great Recession [2007-2009] can be accounted for by the unprecedented extensions of unemployment benefit eligibility.”
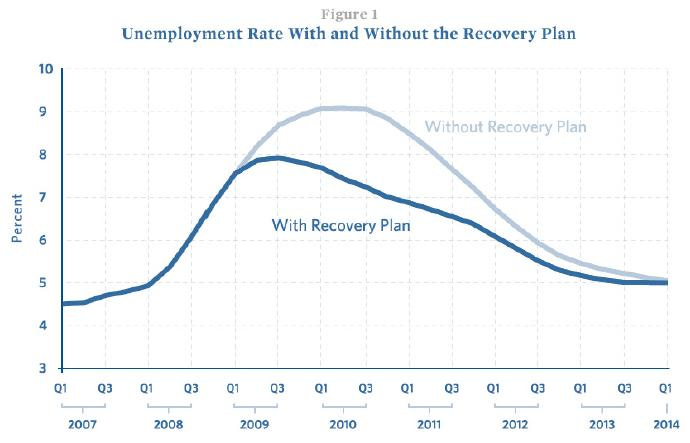
Following that, the chart below is from a report by President Obama’s economic advisers indicating how much lower they said the unemployment rate would be if Congress passed the $1 trillion stimulus bill, compared to what it would be if Congress did nothing.
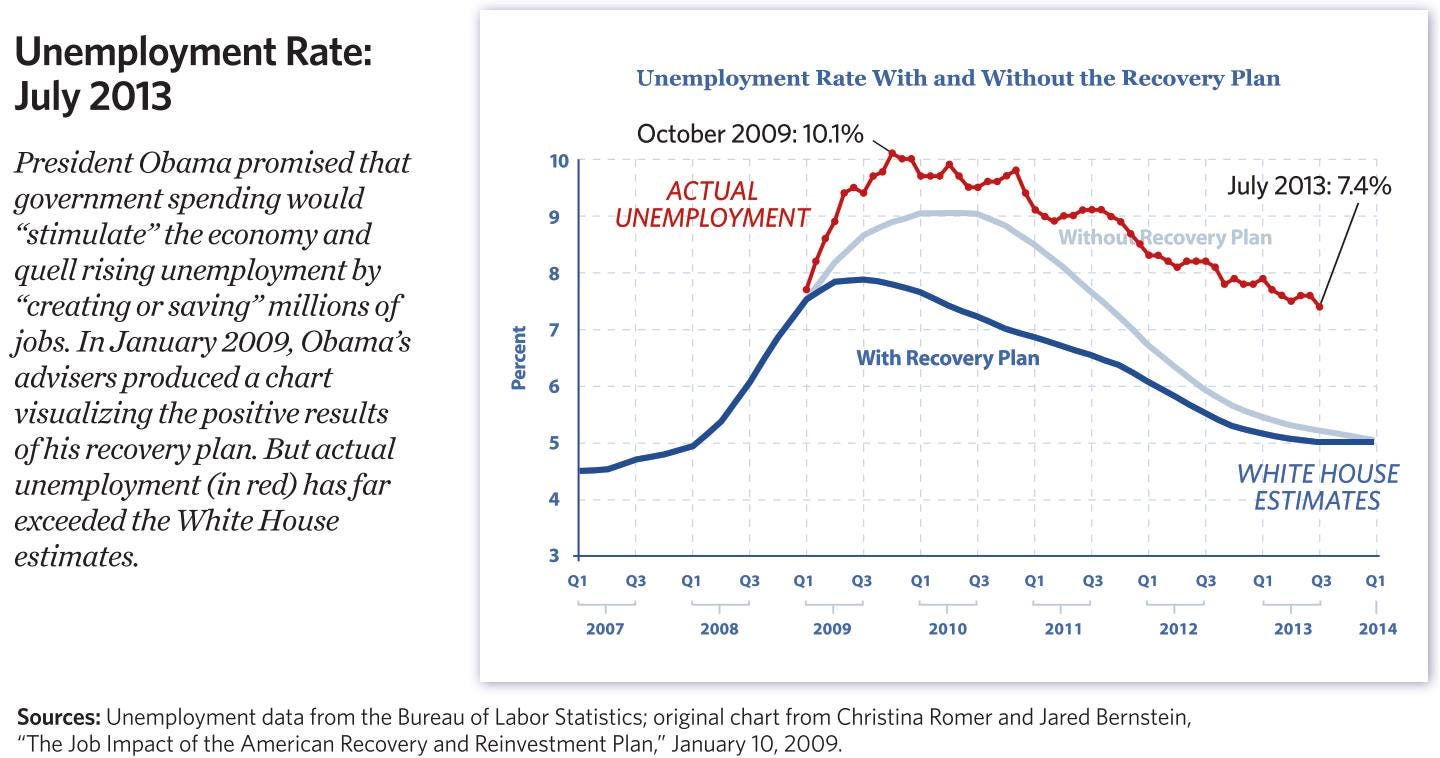
The chart below shows what the unemployment rate actually was after the stimulus law was enacted, showing the unemployment rate was actually higher than what President Obama’s advisers said would be the case if Congress had done nothing.
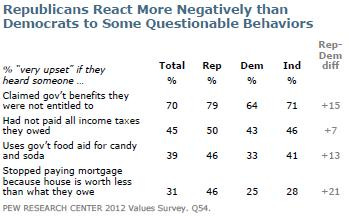
Around this time, in 2012, the Pew Research Center issued the results of a unique survey that showed self-identified Democrats were less likely to react negatively to questionable behavior regarding the abuse of government programs.
Former Federal Reserve governor Lawrence Lindsey also pointed out that “The average annual growth rate from 2010-16 (again assuming 2% real growth for 2016) was 2.1%. The [Obama] administration’s multiyear forecasts averaged a 71% overestimate from this figure. Compounding growth at 3.6% annually means a 28% larger economy after seven years. Compounding at only 2.1% means 15.7% growth. If the administration’s growth projections were accurate, the GDP would be about $1.8 trillion larger. That’s roughly $6,000 for every man, woman and child in the U.S. To err is human … But to plan to continue the same failing policies for another four years while expecting a different result is simply insane.”
President Biden, in 2021, proposed an even more disproportionate stimulus following the COVID-19 pandemic. As former Obama Treasury Secretary Lawrence Summers wrote in the Washington Post:
[R]ecent Congressional Budget Office estimates suggest that with the already enacted $900 billion package — but without any new stimulus — the gap between actual and potential output will decline from about $50 billion a month at the beginning of the year to $20 billion a month at its end. The proposed stimulus will total in the neighborhood of $150 billion a month, even before consideration of any follow-on measures. That is at least three times the size of the output shortfall. In other words, whereas the Obama stimulus was about half as large as the output shortfall, the proposed Biden stimulus is three times as large as the projected shortfall … Looking at incremental deficits relative to GDP gaps is only one way of assessing the scale of a fiscal program. Another is to look at family income losses and compare them to benefit increases and tax credits. Wage and salary incomes are now running about $30 billion a month below pre-covid-19 forecasts, and this gap will likely decline during 2021. Yet increased benefit payments and tax credits in 2021 with proposed stimulus measures would total about $150 billion — a ratio of 5 to 1. The ratio is likely even greater for low-income individuals and families, given the targeting of stimulus measures … If the stimulus proposal is enacted, Congress will have committed 15 percent of GDP with essentially no increase in public investment to address these challenges. After resolving the coronavirus crisis, how will political and economic space be found for the public investments that should be the nation’s highest priority?
As Mr. Summers put it, if the Biden plan passed, as it did, Congress would have spent the equivalent of 15% of GDP responding to COVID-19 before addressing any of Mr. Biden’s other priorities like public works. Mr. Summers later elaborated: “Estimates by Harvard economics professor Raj Chetty and his colleagues suggest that consumer spending by low-income consumers is up more than 13 percent from January 2020 to January 2021, before any new stimulus. Researchers working with data from the JPMorgan Chase Institute find household cash balances have risen across the income distribution during the pandemic.”
As the Wall Street Journal summarized the contents of the legislation:
All told, this generous definition of Covid-related provisions tallies some $825 billion. The rest of the bill—more than $1 trillion—is a combination of bailouts for Democratic constituencies, expansions of progressive programs, pork, and unrelated policy changes.
• Start with the $350 billion for state and local governments and cities and counties, even as state revenues have largely recovered since the spring. Democrats also changed the funding formula to ensure most of the dollars go to blue states that imposed strict economic lockdowns. Last year’s Cares Act distributed money mainly by state population, but much of the $220 billion for states in the new bill will be allocated based on average unemployment over the three-month period ending in December. Andrew Cuomo’s New York (8.2% unemployment in December) and Gavin Newsom’s California (9%) get rewarded for crushing their businesses, while Kristi Noem’s South Dakota (3%) is penalized for staying open. These windfalls come with few strings attached.
• The bill includes $86 billion to rescue 185 or so multiemployer pension plans insured by the Pension Benefit Guaranty Corp. Managed jointly by employer sponsors and unions, these plans are chronically underfunded due to lax federal standards and accounting rules. Yet the bailout comes with no real reform.
• Elementary and secondary schools get another $129 billion, whether they reopen for classroom learning or not. Higher education gets $40 billion. The CBO notes that since Congress already provided some $113 billion for schools—and as “most of those funds remain to be spent”—it expects that 95% of this new money will be spent from 2022 through 2028. That is, when the pandemic is over.
• Enormous sums go to expanding favorite Democratic programs. The package adds $35 billion to pump up subsidies to defray ObamaCare premiums. The bill eliminates the existing income cap (400% of the poverty level) on who qualifies for subsidies, and lowers the maximum amount participants are expected to contribute to about 8.5% of their income, down from 10%. The bill also spends $15 billion to provide a temporary five percentage-point increase in the federal Medicaid match to states that expand eligibility to lower-income adults. This is bait for the dozen or so states that have resisted ObamaCare’s Medicaid expansion, which enrolls working age, childless adults above the poverty line. The political goal overall is to chip away at private coverage on the way to Medicare for All.
• There’s $39 billion for child care; $30 billion for public transit agencies; $19 billion in rental assistance; $10 billion in mortgage help; $4.5 billion for the Low Income Home Energy Assistance program; $3.5 billion for the program formerly known as food stamps; $1 billion for Head Start; $1.5 billion for Amtrak; $50 billion for the Federal Emergency Management Agency; $4 billion to pay off loans of “socially disadvantaged” farmers and ranchers; and nearly $1 billion in world food assistance.
• Don’t forget the $15 an hour minimum wage, which CBO estimates will cost 1.4 million jobs. The bill increases the child tax credit to $3,000 from $2,000 ($99 billion) and temporarily expands the Earned Income Tax Credit to certain additional childless adults ($25 billion). It eliminates the cap on the rebate that drug makers must pay Medicaid for outpatient drugs. This is a rare provision that increases federal revenue ($16 billion), though only by undermining pharmaceutical innovation.
• This being Congress, Members are also slipping in pet causes. Our favorite is $1.5 million for the Seaway International Bridge, which connects New York to Canada and is a priority for New York Sen. Chuck Schumer. And don’t overlook the nearly $500 million for, as the CBO puts it, “grants to fund activities related to the arts, humanities, libraries and museums, and Native American language preservation.”
No wonder Democrats want to pass all this on a partisan vote. It’s a progressive blowout for the ages that does little for the economy but will finance Democratic interest groups for years. Please don’t call it Covid relief.
Larry Summers, head of the National Economic Council under President Obama, wrote this about the Biden Administration budget in 2021: “This is the least responsible macroeconomic policy we’ve had in the last 40 years. The primary risk to the U.S. economy is overheating — and inflation … Policymakers need to accept economic reality. The moment has come to move past emergency policies.”
All this spending by the federal government led to inflation, a phenomenon in which the introduction of more dollars into the economy results in the value of each dollar going down, just as over-producing a product, such as a baseball card, leads to the value of each individual card going down. When the value of each dollar goes down, it takes more dollars to pay for the same thing, and prices go up. And as one economist points out:
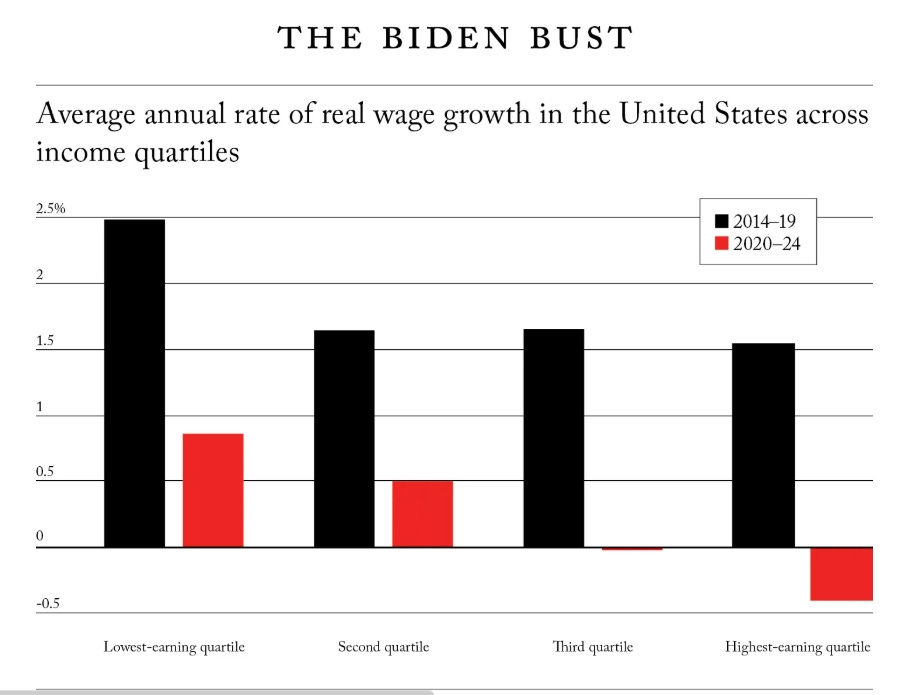
Inflation [during the Biden Administration] did make the median voter poorer during Biden’s term. In no part of the income distribution did wages grow faster while Biden was President than they did 2012-2020. This is true in the raw data, and even more stark after compositional adjustment. In particular, the change in median incomes was well below its 2012-20 run-rate. But, the change in median wages is not what matters; it is the median change in wages that does. And this metric was even weaker under Biden: lower than any period in the last 30 years other than the Great Recession. People do not feel wages, they feel total income. And median growth in total income — post taxes and transfers — was not just historically low: it collapsed and was deeply negative from 2021 onwards.
As Jason Furman, President Obama’s former chief economic advisor, has written:
The Bipartisan Infrastructure Law did little to address the root causes of the United States' long-standing infrastructure unaffordability problem--excessive environmental reviews, labyrinthine permitting processes, and laws requiring that workers are paid prevailing wages--and, in some respects, worsened the crisis by adding new requirements. The permitting reform that was supposed to pass in parallel with the climate bill never became law ... Spending such a huge amount all at once without any steps to increase construction capacity led to even higher cost increases for building materials than was reflected in the overall inflation rate … More important, inflation-adjusted wages have barely increased above pre-pandemic levels, and the entire increase in real wages took place in 2020; on net, real wages have fallen since January 2021.
The large voting segments who reelected President Obama were those under 30; blacks and Hispanics; those making less than $50,000 a year; and unmarried women.
Yet the same demographic groups that elected President Obama later saw their household income and employment rates fall the most since his first election. As Stephen Moore wrote:
Five demographic groups were crucial to his victory: young voters, single women, those with only a high-school diploma or less, blacks and Hispanics … [H]ouseholds headed by single women, with and without children present, saw their incomes fall by roughly 7%. Those under age 25 experienced an income decline of 9.6%. Black heads of households saw their income tumble by 10.9%, while Hispanic heads-of-households' income fell 4.5%, slightly more than the national average. The incomes of workers with a high-school diploma or less fell by about 8% … The unemployment numbers show pretty much the same pattern … The highest jobless rates by far are for key components of the Obama voter bloc: blacks (12.6%), Hispanics (9.4%), those with less than a high-school diploma (11%) and teens (23.7%).
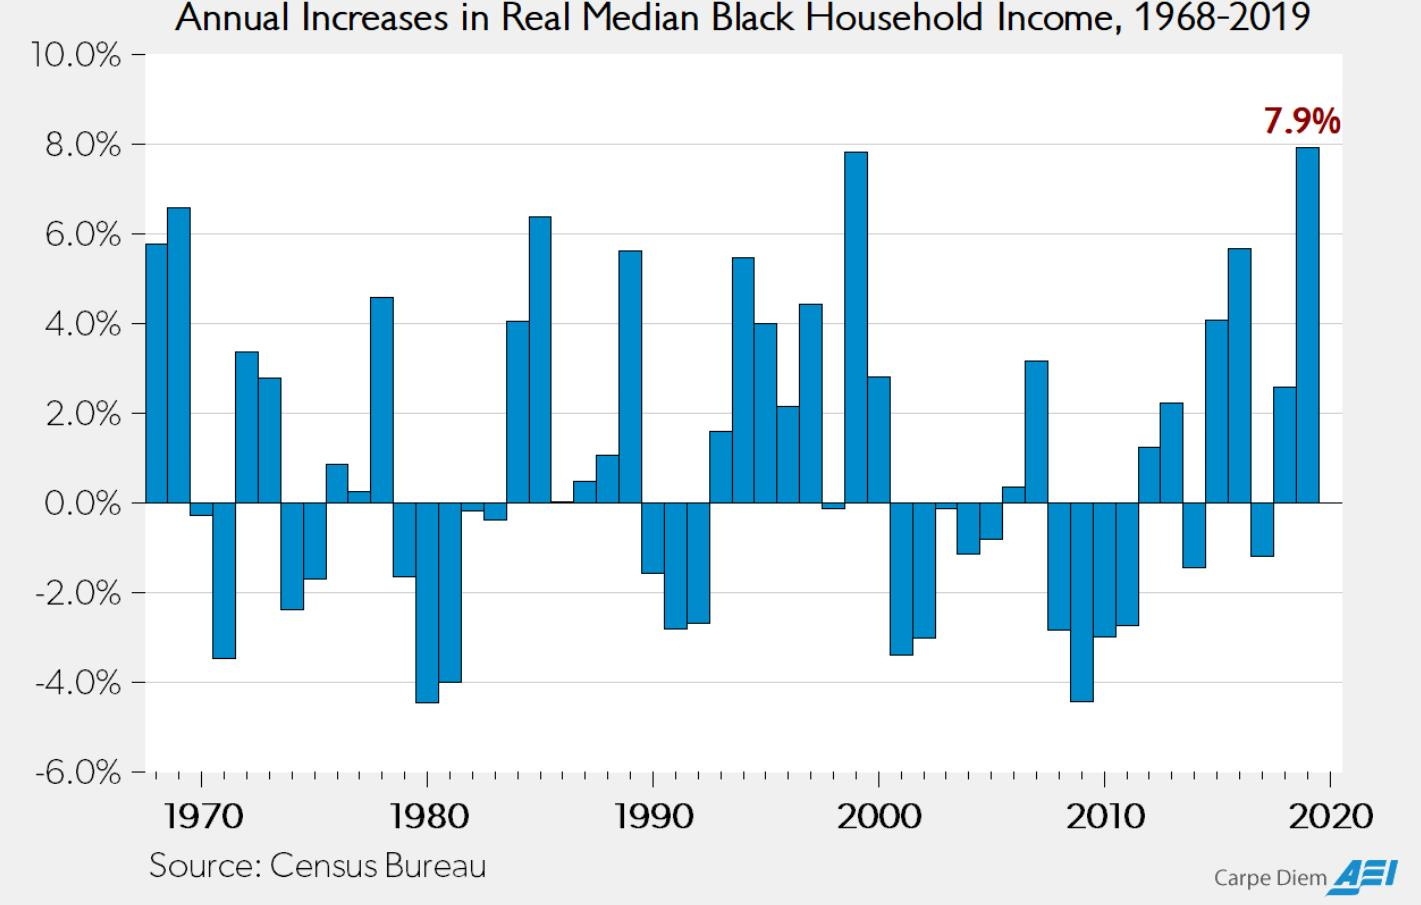
That changed under the first presidency of Donald Trump. As explained by Mark Perry:
The bottom chart above shows the annual gains in real median income for black households in the US from 1968 to 2019. The nearly 8% increase last year was the largest gain on record for black median household income and was almost nine times the average annual increase of 0.90% over the last half-century ... In 1967, there were about five times as many low-income black households (44.5%) as high-income households (9.1%) but by 1993, there were only 2 times as many low-income black households as high-income households, Remarkably last year, due to ongoing increases in prosperity and economic gains for all Americans, there were more high-income black households (29.4%) than low-income households (28.7%) for the first time. Keep those noteworthy, significant income gains and rising prosperity for black Americans the next time you hear about how blacks in America are suffering economically under the Trump administration in a country infected with systemic racism, white privilege, etc.
As Michael Barone has reported:
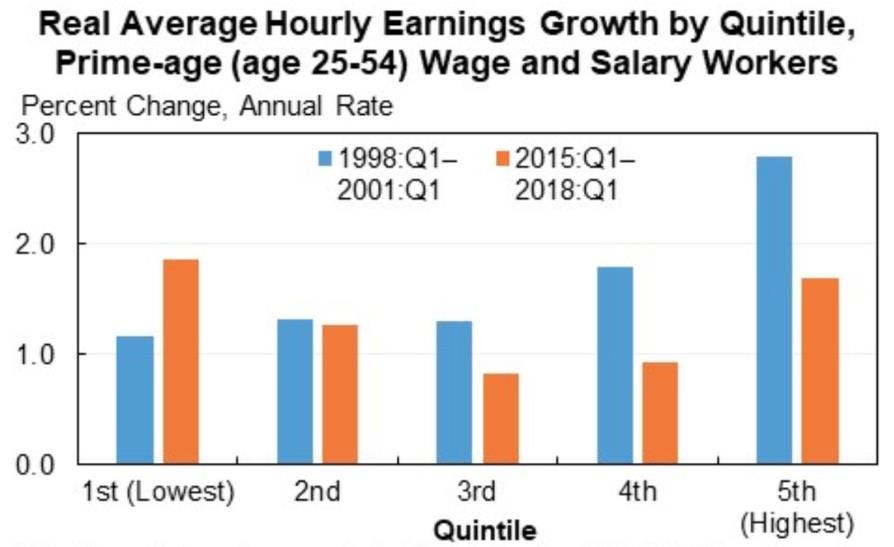
More notable are positive trends among subgroups who weren’t doing so well before Trump took office [in 2017]. Obama administration chief economic adviser Jason Furman, writing at Vox.com, notes that in the past three years “recent wage growth … at the lower end of the wage scale has been stronger” than among those higher paid. Similarly, Bloomberg columnist and portfolio manager Conor Sen makes the point that job growth has been greatest among “goods-producing workers and the least-educated workers.” Both Furman and Sen contrast current trends with those in the 1998-2001 period of torrid economic growth, when income gains were concentrated at the top of the economic spectrum and employment gains were concentrated in office jobs and “meds and eds” -- the government-financed or heavily regulated healthcare and education sectors … The unemployment rate among young Millennials -- those under 25 -- is only 5.1 percent, Sen notes, the lowest since the government began measuring this in 1994. So much for mom’s basement sofa. Black unemployment is down to 6.5 percent and Hispanic unemployment down to 4.6 percent in June, both the lowest number since 1994, when the government began tracking them. Moreover, the labor force is expanding, with 600,000 new entrants in June, notes American University economy Evan Kraft. Simultaneously, the disability rolls are decreasing. All of which suggests that incentives to work are returning to Appalachia and other previously forlorn areas where so many idle people have been driven to opioid dependency.
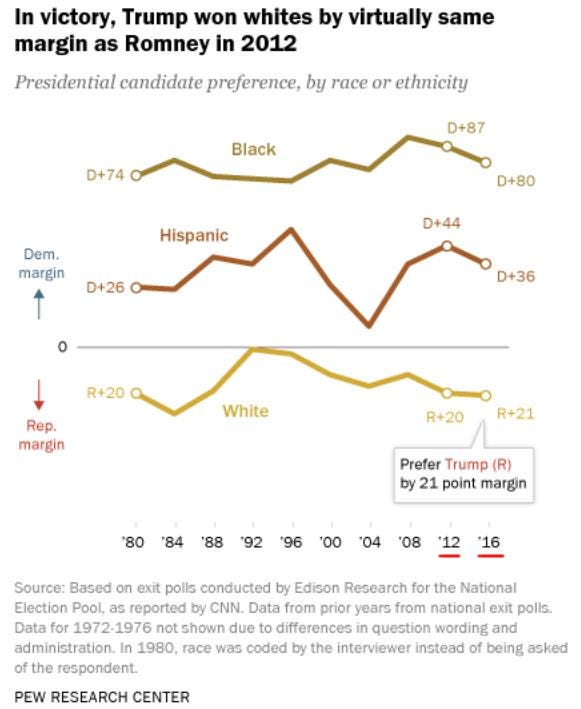
When Donald Trump was first elected president in 2016, he actually received a lower share of the white vote than Mitt Romney, who ran as the Republican candidate in 2012. Musa al-Gharbi also shows that “among supporters of both Democratic and Republican candidates [in 2016], whites were actually less likely to endorse [what some consider] symbolically racist attitudes than they were in 2012. In other words … whites who voted for Trump are perhaps less racist than those who voted for Romney. The same holds among whites who voted for Clinton as compared to those who voted for Obama (in either term).”
According to Musa al-Gharbi, the data show that:
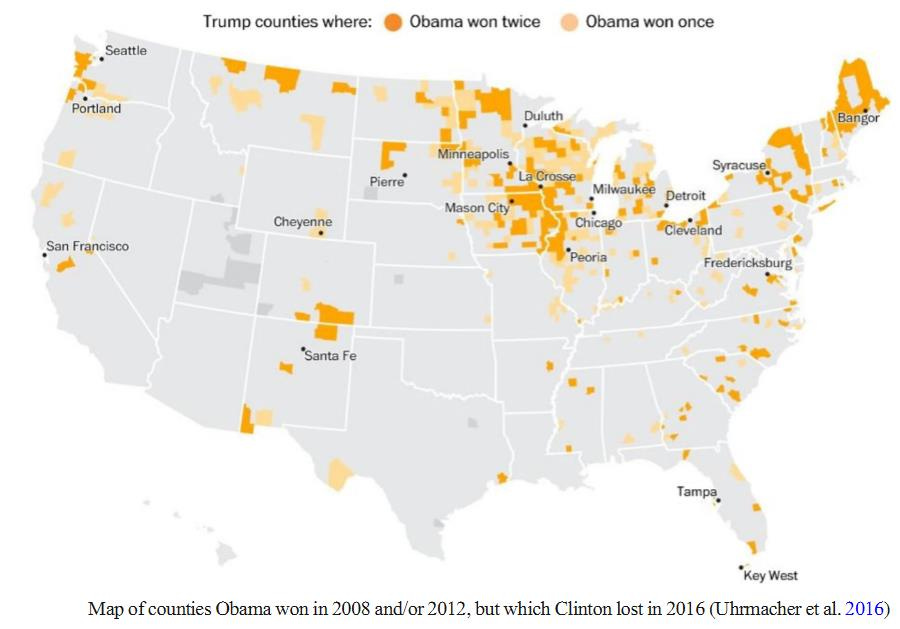
[T]he most decisive votes for turning the [2016] election came from districts that went for Barack Obama in 2008 and 2012 but flipped to the Republicans in 2016. It is unclear why these voters, if horrified at the prospect of a black president, would have voted Obama into office to begin with -- let alone given him another four years to advance his agenda when he stood for reelection. Trump did not spearhead a white uprising: participation rates among whites were roughly equivalent to 2012 and lower than 2008. In fact, whites made up a smaller share of the electorate than they had in previous cycles, while Hispanics and Asians were better represented. Overall, Trump won only about 37% of eligible non-Hispanic white voters. 36% abstained, 24% voted for Clinton, and 3% voted for other candidates. In short, it would be consistent with the data that an overwhelming majority of white voters did find Trump’s rhetoric disqualifying. Among those who did head to the polls, Trump actually won a lower share of the white vote than Mitt Romney. He was nonetheless able to win because he won a larger share of Hispanics and Asians than his predecessor, and won a larger share of the black vote than any Republican since 2004.
Other researchers point out that “[in] the 2016 election … Trump received fewer votes from whites with the highest levels of racial resentment than Romney did in 2012 … Trump’s vote totals improved the most among swing voters: low-socioeconomic status whites who are political moderates.” Still, in the presidential election of 2016, exit polls show that the Republican candidate grew the Republican vote among blacks and Hispanics much more than he grew the Republican vote among whites.
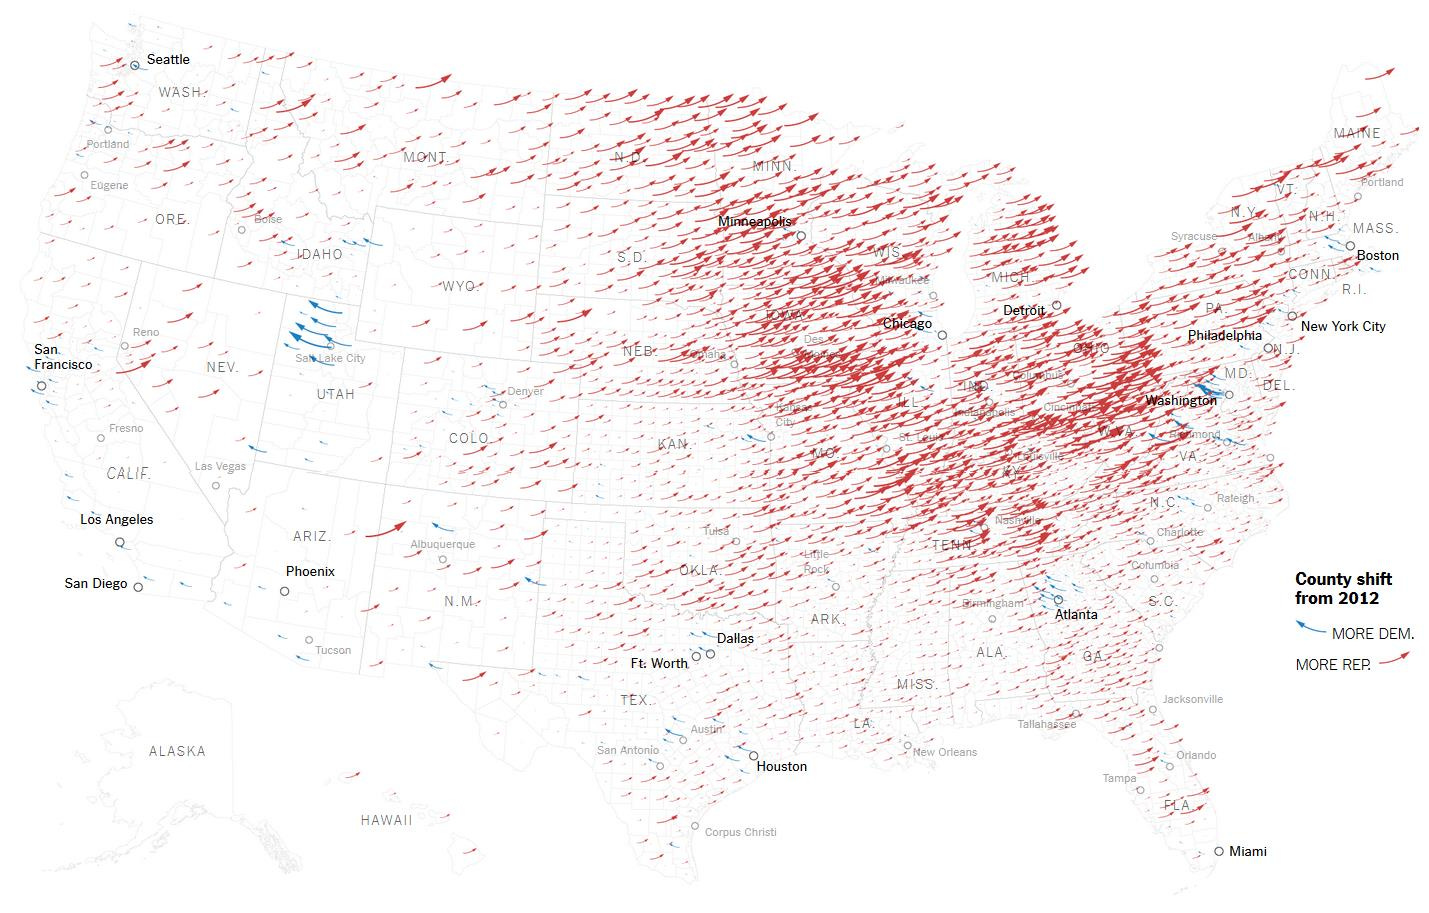
In the 2016 presidential race, the Republican candidate also won rural areas by a greater amount than the Republican candidate in 2012.
The following map shows in darker red the counties won by candidate Trump in 2016 by vote margins higher than candidate Romney in 2012.
During this period, researchers also found that:
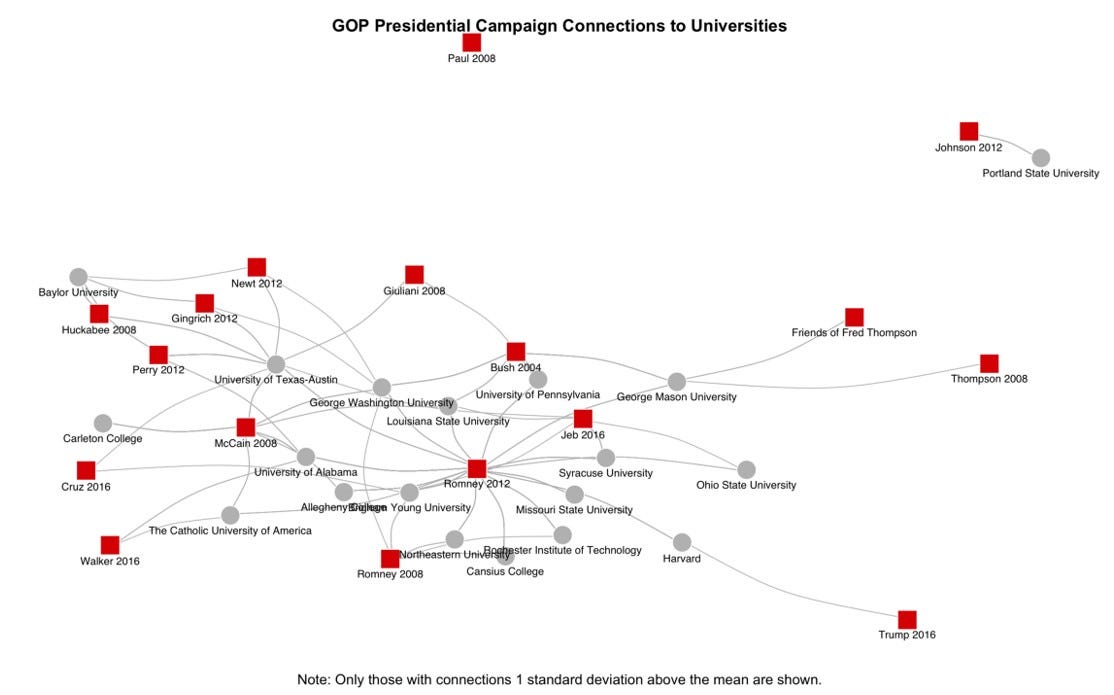
When compared with Republicans, Democratic presidential campaigns much more narrowly draw their top campaign talent in important areas from a handful of elite and mostly private universities … Taken together, an astonishing 20% of all hiring by Democratic campaigns comes from just seven schools: Harvard (5% of Democratic hiring), Stanford (3%), NYU (3%), UC Berkeley (3%), Georgetown (2%), Columbia (2%), and Yale (2%). In 2016, Hillary Clinton’s campaign hired 16% of its staffers from just four schools: Harvard (6%), Stanford (4%), NYU (3%), and Georgetown (3%). In short, elite universities on the coasts dominate Democratic hiring. Only one public university, UC Berkeley, falls in the top ten of Democratic hiring. The rest are elite private, non-profit, educational institutions. To get a different look at the data, using staffers’ educational backgrounds, we network analyzed the diversity of connections among presidential campaigns and the universities where staffers graduated. We found that Democratic presidential campaigns have continuously hired staffers from a homogeneous group of universities. Since 2004, Democratic presidential campaigns have hired 25% of the staffers in our dataset from 15 universities including Harvard, NYU, Stanford, Georgetown, UC Berkeley, Yale, Columbia, University of Chicago, Boston University, and DePaul, just to name the top ten. A very different picture emerges on the other side of the aisle. The top three Republican schools are state public institutions: University of Texas, Austin (3%), Ohio State University (2%), and the University of Wisconsin-Madison (1%). The rest of the schools in the Republican top twenty are a mix of public and private institutions, including state schools such as George Mason (2%), the University of Alabama (2%), and Missouri State University (1%) and Brigham Young (2%). Notably, our data indicate that only 13% of Republican staffers active during the 2016 cycle graduated from an elite, private university. Republican presidential campaigns predominately hired staffers from public universities such as the University of Texas, Austin (9%), University of Wisconsin (3%), and the University of Oklahoma (3%), as well as private schools such as Syracuse (7%) and Baylor University (3%).
By March 2018, liberal economist Thomas Piketty had shown that the Democratic Party in America (as well as the left-wing parties in France and Britain), had gone from largely representing working class people to largely representing university graduates.
As one newsletter wrote:
[O]nce upon a time the Republicans were the party of the rich and the Democrats the party of working-class Americans. Now the parties’ bases have flipped. Republicans tend to dominate blue-collar America and Dems are the party of the elites. Now Democrat Marcy Kaptur of Ohio, who has represented her Toledo, Ohio district in Congress for 40 years, is warning her party that they are rapidly losing the support of Main Street and mainstream America. This chart from Rep. Kaptur proves our/her point. It shows that Democrats now represent 19 of the top 25 highest-earning districts, including six in California and four around the Washington D.C. Beltway. Republicans represent a narrow majority of the lowest 25 districts by income. She asks a crucial question: “How is it possible that Republicans are representing the majority of people who struggle? How is that possible?”
In the next essay in this series, we’ll continue our exploration of voting trends over the last couple decades, leading up to the 2024 presidential election.








Paul, I try to stay up with this stuff. But you always give me new perspectives and lots of new knowledge. Many thanks once again.