Mismeasuring Economic Inequality – Part 4
The failure to reasonably measure the influence of technology on well-being.
In this essay, we’ll examine, in analyses of economic inequality, the failure to reasonably measure the influence of technology on well-being.
While characterizations of the Industrial Revolution often focus on its downsides (like pollution and overcrowding in cities), there was a much more significant upside. In their book The Myth of American Inequality: How Government Biases Policy Debate, Phil Gramm, Robert Ekelund, and John Early write:
[During the Industrial Revolution] [h]uman effort surged, capital accumulated, and knowledge and productivity exploded. Agrarian and handicraft production gave way to mechanization. Rural populations and rural life gave way to urban society as people left rural areas for what they perceived to be a better life in the cities. The movement of people began before the end of the eighteenth century and accelerated markedly by the 1830s. By the mid-nineteenth century, urban dwellers accounted for half the total population of England. Poverty in rural England had been largely hidden. The poor lived in villages off the road or in the forest, and even a rundown mud shack, when viewed at a distance across the creek, looked picturesque. When huge numbers of relatively poor people flooded into the cities in search of a better life, they were painfully visible. Many authors of both fiction and philosophy in the Victorian era had apparently seen little of rural poverty, and that view of real life in rural areas appears to have been from the veranda of a manor house. But farm and village workers saw the poverty and hopelessness of rural life up close and personal, and while poverty and hardship were visible everywhere in the cities, the potential rewards for moving there were great.
As the authors write, the technological progress spurred by the Industrial Revolution hasn’t stopped, and it should be accounted for in analyses of poverty:
A second line of inquiry about poverty measures looks at the actual standard of living of families officially classified as poor by Census and demonstrates that most of those defined by the Census as being poor actually have a standard of living more consistent with being middle income. Data from the Census American Housing Survey for 2011 showed that among the households that are officially defined as being poor, 42 percent owned their own home with, on average, three bedrooms, one and a half bathrooms, a garage, and a porch or patio. Half lived in single-family homes or townhouses, 40 percent in apartments, and 10 percent in mobile homes. Only 7 percent of the poor lived in housing classified as “crowded,” and two-thirds had more than two rooms per person. The average poor American family lived in a home that was larger than the average for a middle-income French, German, or British family … Families defined as poor also had significantly greater amenities for daily living than those defined as poor fifty years ago. For example, 88 percent of poor households had air conditioning, compared with only 12 percent of the entire population that had air conditioning in 1964. Most families classified as poor had multiple color televisions, one-third with wide, flat screens. Two-thirds had cable or satellite television. One-quarter had a digital video recorder. More than half of those with children had a video game system such as Xbox or PlayStation. Fifty-nine percent had internet access, and 72 percent had at least one computer. Almost three-quarters had a car or truck, and 31 percent had two or more cars or trucks … No government metric comes close to capturing the full value of modern communications technology … Children had worked as field hands and servants since the beginning of settled agriculture more than ten thousand years before. There is no evidence that child labor was more pervasive in urban areas during the early nineteenth century than it had been in rural areas. But there is overwhelming evidence that the movement from the farm to the factory led to a dramatic reduction in child labor. As economic historian Clark Nardinelli concluded, “Technological change reduced the demand for child labor and increasing income reduced the supply. The Factory Acts, then, did not cause the long-term decline in child labor.” The broad-based abundance created by the Industrial Revolution during the Victorian era produced widespread school attendance and almost-universal literacy. In closing the ugly ten-millennial chapter of child labor by the end of 1900, the Industrial Revolution ushered in a new chapter of childhood nurturing and learning … Does wage stagnation remotely describe the life you have lived over the last five decades or in any way square with numerous other official measures of changes in the actual physical items Americans own and consume? In short, should you believe your eyes or the official government measure of real hourly earnings? Compared to 1972, our homes today are much more spacious and modern. The proportion of homes with two or more rooms per person is 33.5 percent greater today. The proportion with two or more bathrooms has grown by 200.5 percent; 313.1 percent more have central air conditioning; and 68.3 percent more have dishwashers. Most homes in 1972 had televisions, but only about half were color. Today they are all color, and most are high-definition, flat-screen TVs connected to cable or satellites. Most homes in 1972 had at least one phone, but none had cell phones or internet access. Our kitchens today are stocked with a far greater array of food products, out-of-season fruits brought from half a world away, and a vast variety of prepared foods. Remarkably, as compared to 1972, this abundance of food costs an ever-smaller portion of our families’ budgets, freeing up $3,200 in 2017 that the average family can now spend on other things. Our cars last more than twice as long, they are almost four times safer, and many have GPS navigation and premium sound systems. No standard model lacks air conditioning or power steering. Today almost three times as many of us are college graduates. Americans live 7.8 years longer, partly because the death rates from cancer declined by 31 percent from 1991 to 2018. Our median age is almost ten years older, and yet the proportion of people reporting poor health is 20.3 percent smaller. Real median household net worth is up 172.2 percent. In short, by virtually any physical definition of economic well-being, working Americans across all income levels, racial classifications, education levels, and other commonly used statistical classifications are substantially better off today than they were in 1972.
There are also biases in a measurement called the “Consumer Price Index” (CPI), which is intended to measure changes in the prices of the same things over time. But as the authors write:
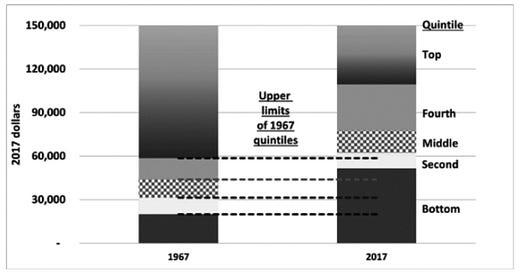
In addition to understating measures of well-being, the upward biases in consumer price indexes adversely affect the overall fiscal health of the nation. Many government payments such as Social Security and federal employee pensions are automatically increased by cost-of-living adjustments based on the percentage change in the CPI. Other programs such as Medicaid and food stamps establish eligibility based on poverty guidelines or other CPI-adjusted income levels. The upward biases in the CPI increase benefit levels by more than the true change in the cost of living and add beneficiaries who would not otherwise qualify. From 2000 to 2017, the seven largest federal benefit programs that contain automatic cost-of-living adjustments for benefit levels or eligibility spent a total of approximately $6.8 trillion providing those cost-of-living adjustments. If, instead, the adjustments had been made using the more accurate Chained CPI, which eliminates substitution bias, the increase in government spending would have been $1.1 trillion smaller. And if, in addition, a price index had been available that took more complete account of the value of new and improved products, the cost-of-living adjustment might have been as much as $2.6 trillion smaller … If the Chained CPI had been used from 2000 to 2017 to adjust both income tax brackets and spending for the seven largest programs with cost-of-living adjustments, the national debt held by the public would have been $1.4 trillion smaller than it is today … Figure 9.1 applies the same traditional price index used by Census to adjust income for inflation … [It] shows the distribution of income after transfers and taxes in 1967 on the left and that income distribution in 2017 on the right, both in 2017 dollars. The horizontal dashed lines define the upper limit of the income quintiles in 1967 and are extended to the 2017 distribution to show how the income quintiles in 2017 compare with the inflation-adjusted 1967 levels. Even though fifty years is a long time, the comparison is still startling.
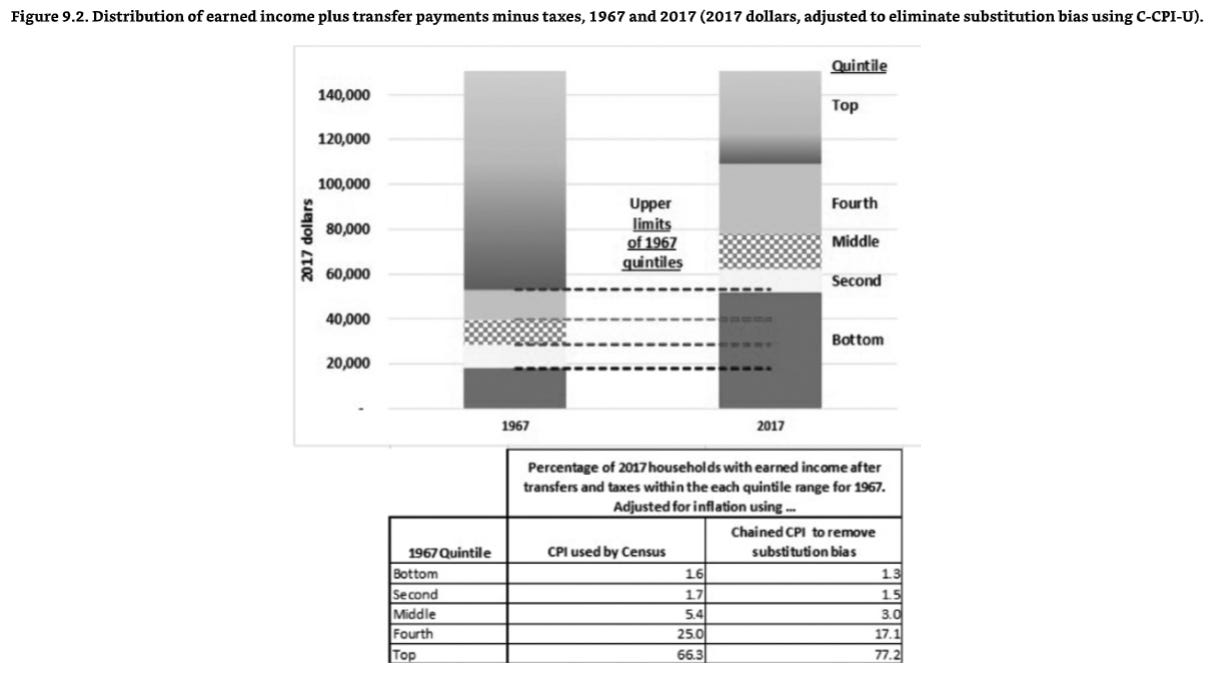
When all the transfer payments to households are counted as income and household income is reduced by the taxes paid, not only do both the top and the fourth quintiles in 2017 have income that would have placed them in the top quintile in 1967, but all the households in the middle quintile and almost a third of those in the second quintile also had incomes equivalent to top-quintile incomes in 1967. An extraordinary 66.3 percent of households in 2017 had incomes after transfers and taxes that would have been enjoyed only by those in the top quintile in 1967. Figure 9.2 shows the results of using the official price indexes that eliminate the substitution bias. By using the more accurate measure of price changes, we can see that almost all of the second quintile households in 2017 received incomes after transfers and taxes that were large enough to have put them in the top quintile in 1967. An extraordinary total of 77.2 percent of all households had incomes in 2017 that were equivalent to the top quintile of 1967 in inflation-adjusted dollars.
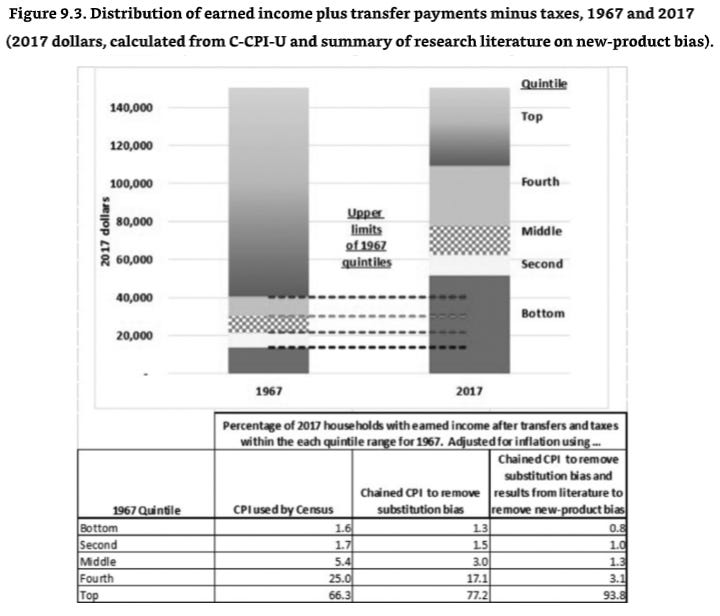
Figure 9.3 displays the results of adding estimates for the effects of new and improved products to the price index used to adjust household income for inflation. When the inflation adjustment accounts more completely for the extraordinary improvements in our well-being from new and improved products over the last fifty years, all but 6.2 percent of households in 2017 had incomes that would have placed them in the top quintile in 1967 … Consider how in 1967 the bottom- and second-quintile levels of American households lived. In 1967, about half of all households in the bottom quintile lacked “complete” plumbing (piped hot and cold water, a flush toilet, and a bathtub or shower). Those days are gone because fewer than 2 percent of the bottom-quintile homes lack those basics today.6 Many homes in both of the lower-income quintiles still had party-line telephones or even none at all. Now there is hardly a household without at least one smart cell phone with internet access.
Even the fact that the lower income households today are economically as well off as some households in the top 20 percent of income in 1967 is easily understood. Health insurance for the top quintile would usually have covered only hospitalization in 1967, but most of the poorest households in the land now get full, first-dollar coverage without any cost sharing. Even with full coverage, the poorest today are still about 20 percent less likely to need hospitalization than their rich predecessors in 1967 because of improved treatments. When people at any income level go to the hospital, they will stay only a fraction of the time spent in 1967, are more likely to emerge fully restored, and are far less likely to be readmitted with the same complaint. An average lower-income person in 2017 will live eight years longer than a top-quintile person did in 1967 … Nobody, however rich, in 1967 had any of the services available over the internet—and only the mega rich in the top fraction of 1 percent of income could afford personal shoppers to go to the store to pick up what they wanted, research assistants to go to the library to dig out knowledge they wanted to have, and tax advice that even the poorest household today can access through a computer or smart phone … And when it came to home chores, clothes dryers were rare, and dishwashers were even rarer. Now they are almost universal. In 2017, almost every household has a color television set, and most have multiple sets with large flat screens … If you were an adult fifty years ago, think about the top 20 percent of the homes in your hometown—not the top 10 percent or the top 1 percent but the homes that were comfortable but less than mansions. They were the only homes with central air conditioning and two or more full bathrooms. Today, most families classified as poor have both … In 1967, the middle quintile might vacation in the family car or by bus; the top quintile might fly, mostly in a prop plane. Today, cheap tickets are used by people in all income brackets to jet throughout the nation and, increasingly, throughout the world … And if they choose to travel by car, the Cadillacs and Rolls-Royces of the crème de la crème in 1967 broke down ten times more often than the Ford owned by a bottom-quintile family in 2017. The Ford will also last twice as along and be four times safer … Eating food away from home at a restaurant where somebody else prepared the meal was a hallmark of a high-income lifestyle in 1967. In the mid-1960s, households in the top quintile spent 27 percent of their food budget on food away from home. But by 2017, the average bottom-quintile household spent 34 percent of its food budget away from home, far more than the top quintile did in the mid-1960s and more than even the top 1 percent did … The more basic consumption of food at home also has shown substantial improvement in the average standard of living. In 1967, the US Department of Agriculture’s “low-cost” food plan for the bottom quintile would have required the average production or nonsupervisory employee to work two hours and thirteen minutes per day during a five-day workweek to feed a family of four. In 2017, that same amount of work would have enabled the same worker to buy the “moderate cost” food plan and have earnings left over from an additional eighteen minutes of work to buy other things; an additional eight minutes of work would enable the worker to purchase the same top-grade diet consumed by the top quintile. Even in low-tech products such as food, many bottom-quintile households in 2017 could easily obtain the food consumed by the top quintile fifty years earlier.
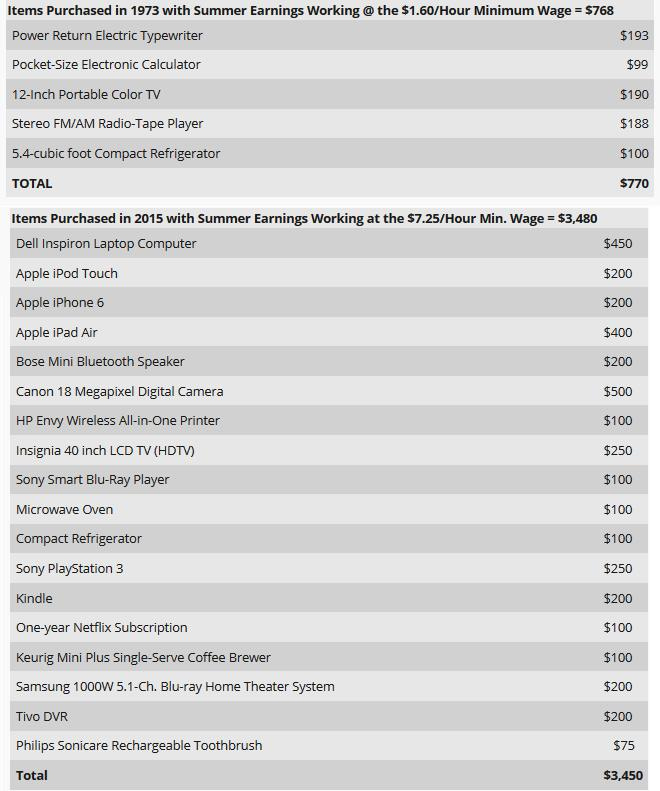
To get a sense of how relatively unregulated technologies have gotten so much better and cheaper over time, see the chart below, which compares what a typical student headed to college could afford with minimum wage summer earnings in 1973 compared to 2015, keeping in mind that today’s minimum wage of $7.25 an hour is actually 13 percent below the inflation-adjusted minimum wage of $8.60 an hour (in 2015 dollars) in 1973.
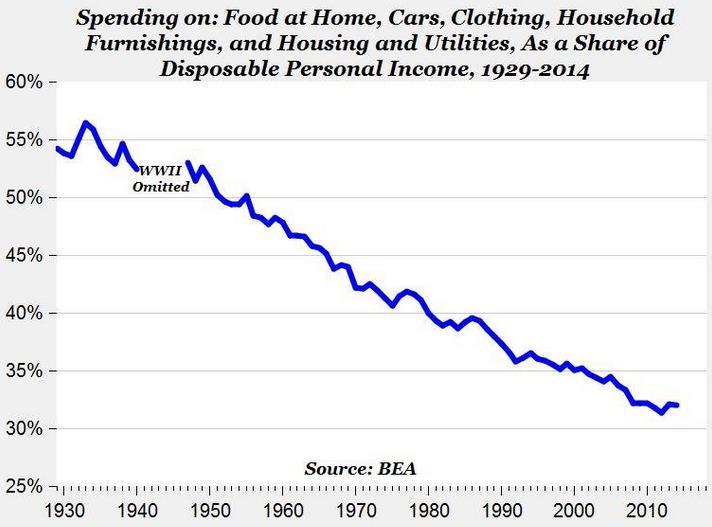
Also, over the last eighty years, as technology has improved and made the production of life essentials more efficient (and their prices cheaper) spending on food at home, cars, clothing, household furnishings, and housing and utilities, have generally declined as a share of disposable personal income.
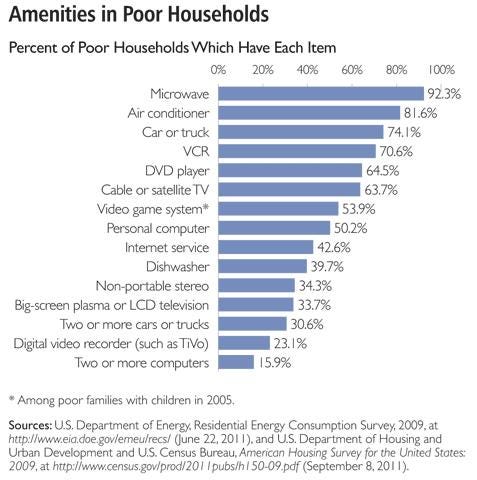
In assessing what it actually means for someone to be living “in poverty” under official definitions of the term, it is useful to keep in mind that a large majority of those “in poverty,” over a decade ago, according to the Census Bureau, had cable or satellite television, a DVD player, and a video game system, along with cars, microwave ovens, air conditioning, and cell phones. Advancing technology has generally allowed the same types of consumer goods (such as microwaves, air conditioning, personal digital devices, computers, and cell phones) to be readily available to the rich and poor alike.
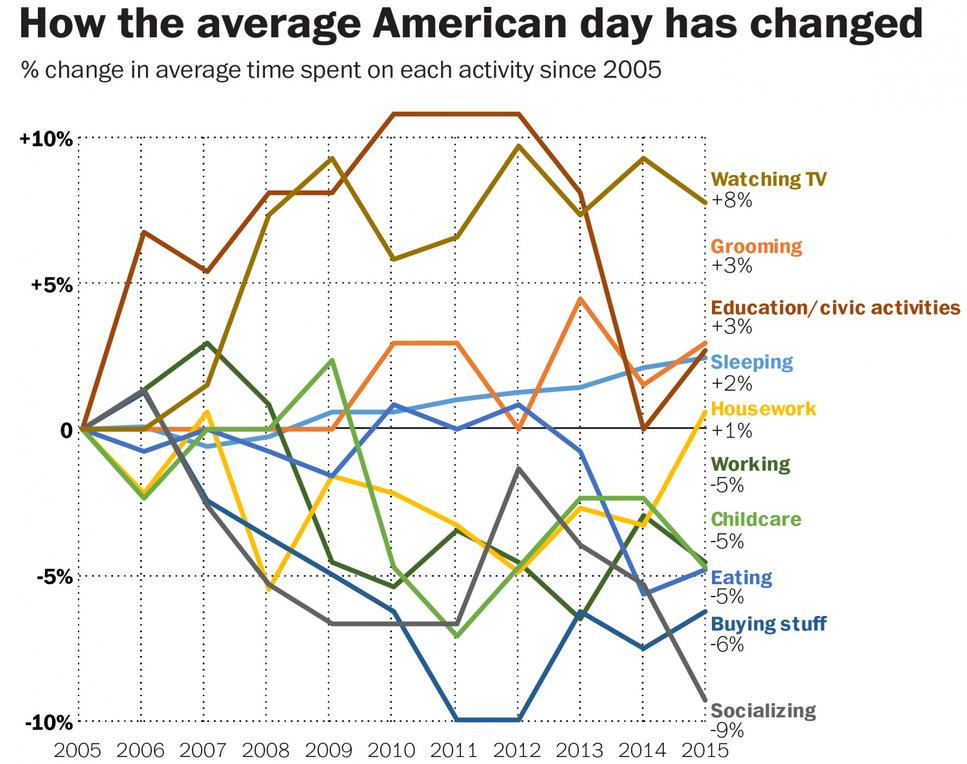
And as technology has dramatically improved, so has its allure. Over the last ten years, Americans have come to spend 8 percent more time watching television, and 5 percent less time working.
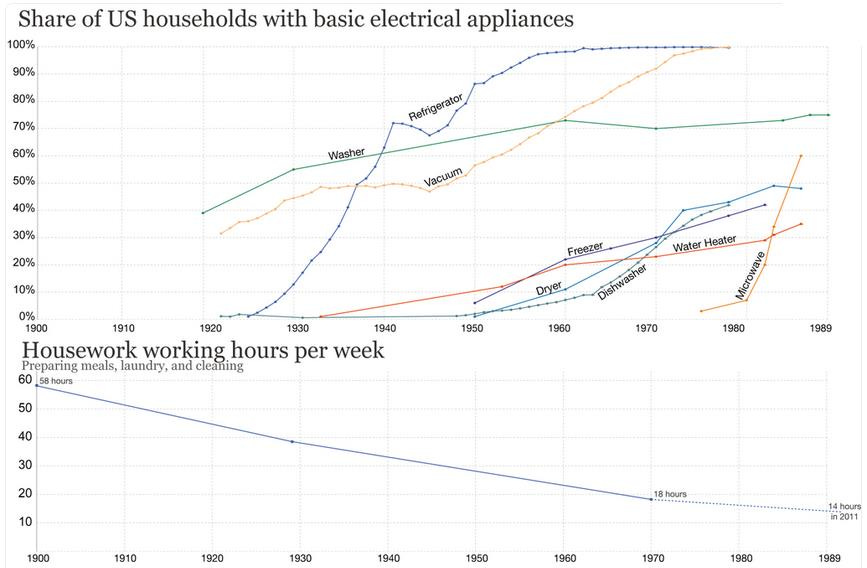
Over the past century, household work-saving appliances have become widespread, and the numbers of hours per week devoted to household chores has plummeted (and this chart only goes up to 1989).
And not only has technology made life easier for everyone, but its allure is especially strong for those not working. Researchers have found that video games occupy an increasing amount of the leisure time of the unemployed:
During the period 2004-15, approximately 60 percent of the 2.3 hours of increased leisure time per week for young men was spent playing video games, while younger women and older men and women spent negligible extra leisure time in this way. These data are drawn from the American Time Use Survey (ATUS). In all, young men's time playing video games increased by 99 hours per year from 2004 to 2015, a 50 percent increase. The researchers document that time spent playing video games is very sensitive to total leisure time for younger men, but not for other demographic groups such as younger women or older men. They estimate that innovations to recreational computing and video games since 2004 can explain on the order of half the increase in leisure for younger men, and could explain a decline in work hours of 1.5 to 3.0 percent, or 30 to 60 hours per year.
The Economist points out that:
The single biggest new media habit to be formed during the pandemic appears to be gaming. The extra hour per week that people spent gaming last year represented the largest percentage increase of any media category. And unlike other lockdown hobbies, it is showing no sign of falling away as life gets back to normal. It has become “a sticky habit”, says Craig Chapple of Sensor Tower. He finds that last year people installed 56.2bn [billion] gaming apps, a third more than in 2019 (and three times the rate of increase the previous year). The easing of lockdowns is not denting the habit: the first quarter of 2021 saw more installations than any quarter of 2020. Roblox, a sprawling platform on which people make and share their own basic games, reported that in the first quarter of this year players spent nearly 10bn hours on the platform, nearly twice as much time as they spent in the same period in 2020 … [W]hereas all other generations of Americans named television and films as their favourite form of home entertainment, Generation Z ranked them last, after video games, music, web browsing and social media.
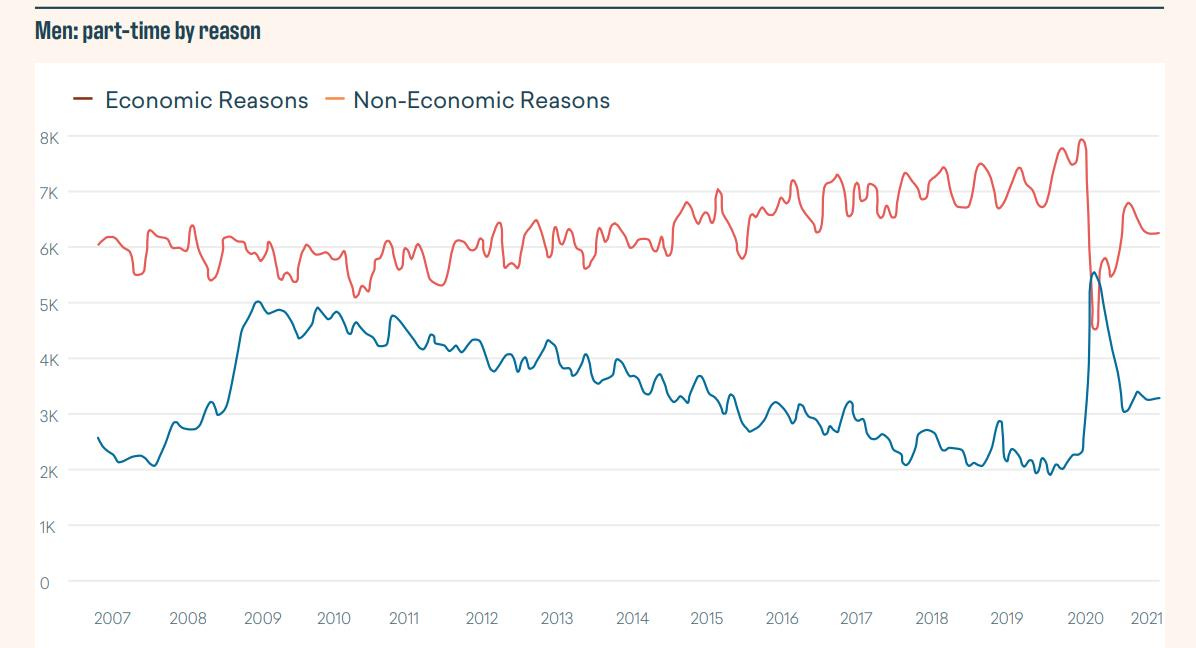
The labor market data firm Emsi found the following: “Why the dramatic shift to part-time work, even during a time defined by prosperity and opportunity? One short and surprising answer is our second topic: video games. Yes, really. According to NBER research, the decrease in hours worked for men ages 21-30 exactly mirrored the increase in video game hours played. On average, males ages 21-30 worked over 200 fewer hours in 2015 than they did in 2000 (a 12% decline). They simultaneously upped their leisure hours, 75% of which were spent playing video and computer games. Many of these men do not have a bachelor’s degree, and the data shows they are postponing marriage, child rearing and home buying until their 30s.”
In the next essay in this series, we’ll examine the effects of education on economic inequality.

