Mismeasuring Economic Inequality – Part 9
Income mobility in relation to race, continued.
In this essay, we’ll continue to look at income mobility in relation to race.
Recent research by the Equality of Opportunity Project, run by professors at Harvard and the University of California at Berkley, concludes that income upward mobility across generations is more associated with two parent households, better elementary and high schools, and more civic engagement, including membership in religious groups (rather than with policies of higher taxes on the rich). “It’s actually not clear to me that a more progressive tax code is necessarily the solution,” Mr. Chetty [one of the researchers] said. “Many think of the American Dream as ‘earning’ more than their parents, not getting more transfers from the government than their parents.”
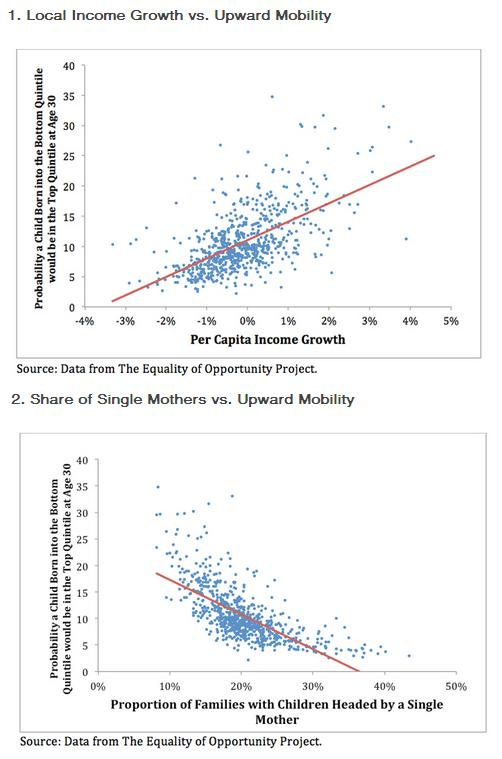
Another analysis of the data from the Equality of Opportunity Project shows that communities with high levels of per-capita income growth and high percentages of two-parent families are the most likely to allow poor children to become upwardly mobile.
As Richard Doar has explained:
In a recent paper, Raj Chetty, Nathaniel Hendren, and their colleagues at Harvard found that proximity to more employed people correlated with increased upward economic mobility for children. They concluded, “Evidently, what predicts upward mobility is not proximity to jobs, but growing up around people who have jobs.” My AEI colleague Nick Eberstadt found that men without work spend far more time in front of screens than nearly any other group, averaging over 2,100 hours per year. This kind of inactivity has negative consequences for these men, and negative consequences for our society.
Black and white girls from families with comparable earnings attain similar individual incomes as adults, but the same does not apply for black boys. According to Raj Chetty and other researchers:
[Our] analysis … has shown that childhood environment has significant causal effects on black-white gaps. Black boys do especially well in neighborhoods with a large fraction of fathers at home in black families … However, very few black boys grow up in such areas in the U.S. 4.2% of black children currently grow up in areas with a poverty rate below 10 percent and more than half of black fathers present. In contrast, 62.5% of white children grow up in low-poverty areas with more than half of white fathers present. These disparities in the environments in which black and white children are raised help explain why we observe significant black-white gaps in intergenerational mobility in virtually all areas of the U.S. … Policies focused on improving the economic outcomes of a single generation (such as cash transfer programs or minimum wage increases) can narrow the gap at a given point in time, but are less likely to have persistent effects unless they also affect intergenerational mobility. Policies that reduce residential segregation or enable black and white children to attend the same schools without achieving racial integration within neighborhoods and schools would also likely leave much of the gap in place, since the gap persists even among low-income children raised on the same block.
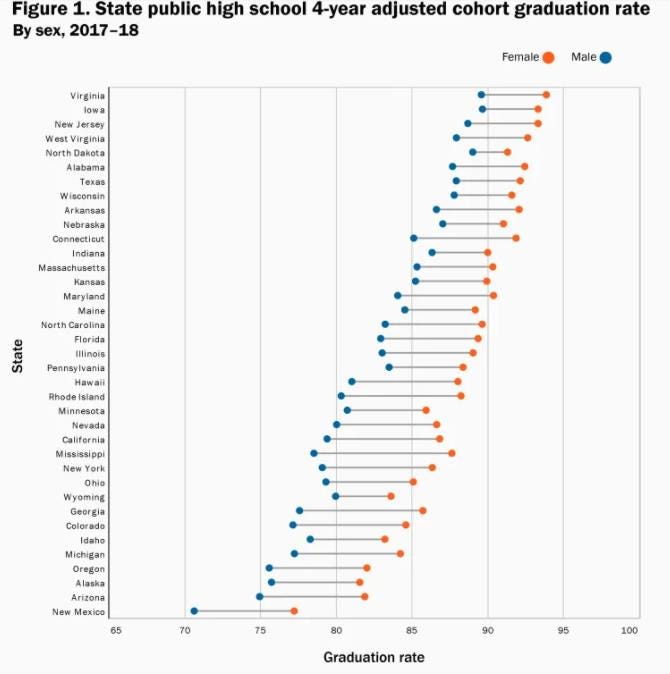
The Brookings Institution has compiled the following high school graduation rate statistics, showing girls have much higher graduation rates than boys, with black male students even further behind.
As Ian Rowe has testified before Congress:
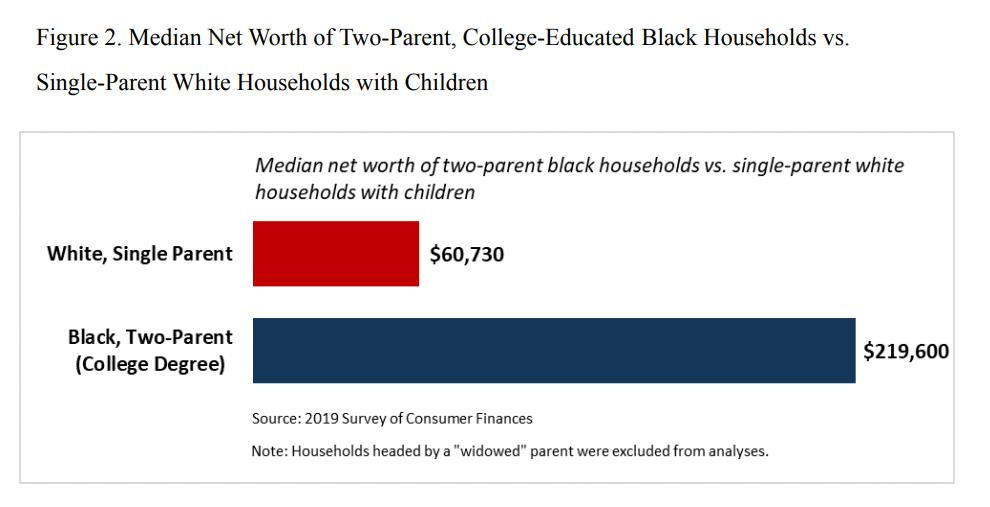
a range of studies have identified “toxic levels of wealth inequality,” especially between black and white Americans. According to the Federal Reserve’s 2019 Survey of Consumer Finances, the wealth gap between Black and white Americans at the median — the middle household in each community — was $164,100. The median Black household was worth only $24,100; the median white household, $188,200. Seven times. For some, this gap is vibrant proof of a permanent and insurmountable legacy of racial discrimination … The same 2019 Survey of Consumer Finances that shows the average black family has one seventh the wealth of the average white family also shows the reverse when family structure is considered. Indeed, black households headed by two married parents have slightly higher wealth than the median net worth of the typical white, single-parent household (Figure 1).
And when education is considered, on an absolute basis, the median net worth of two-parent black households is nearly $220,000 and more than three times that of the typical white, single-parent household. See the chart below.
Moreover, the 2017 report The Millennial Success Sequence finds that a stunning 91 percent of black people avoided poverty when they reached their prime young adult years (age 28–34), if they followed the “success sequence”—that is, they earned at least a high school degree, worked full-time so they learned the dignity and discipline of work, and married before having any children, in that order.
Cleveland Federal Reserve economists constructed a sophisticated economic model capable of projecting changes in household wealth over decades, factoring in things like inheritances, income and financial portfolio composition and concluded that “We find that one factor accounts for the racial wealth gap almost entirely by itself: the racial income gap.” It’s this gap in income in the earnings of blacks and whites since the 1950’s -- not vestiges of slavery or the effects of slavery on accumulated inheritances -- that best explains racial differences in wealth today.
As the Cleveland Federal Reserve economists wrote:
[W]hile the existence of a racial wealth gap may not be altogether surprising, it may be surprising how little the racial wealth gap has changed over the past half century, even after the passage of civil rights legislation. In fact, the 2016 wealth gap is roughly the same as it was in 1962, two years before the passage of the Civil Rights Act of 1964, according to data from the Survey of Consumer Finances (SCF). Average white wealth in 1962 was 7 times that of average black wealth. The persistence of the racial wealth gap can be seen in fi gure 1, which plots the distributions of wealth in 2016 dollars for black and white households in the years 1962 and 2016. While there has been growth in wealth over time for both racial groups (as evidenced by the rightward shift between the solid and dashed lines), notice that the dashed line corresponding to black households in 2016 is still to the left of the solid line for white households in 1962 … Gittleman and Wolff (2004) examine three survey years of the Panel Study of Income Dynamics (PSID), 1984, 1989, and 1994, and fi nd little evidence that black households earned lower returns on the same assets as white households. However, they do fi nd that the portfolios held by black households were more concentrated in low-average-return assets … One explanation for the higher concentration of low-averagereturn assets in black households’ portfolios could be those households’ lower wealth levels. Higher returns are associated with higher risk, and the less wealth a household has, the less risk it may be willing to take with its investments. While portfolio differences are real and impactful, these data suggest that portfolio differences are not the most signifi cant factor contributing to the racial wealth gap. Gittleman and Wolff estimate that over 1984–1994 the wealth gap would have closed by only an additional 4 percentage points if black households had held the same portfolios as white households … Menchik and Jianakoplos (1997) estimate that between 10 percent and 20 percent of the racial wealth gap can be accounted for by inheritances, while Gittleman and Wolff (2004) fi nd that if black households had the same inheritances as white households, the wealth gap would have closed by an additional 5 percentage points. However, differences in inheritances do not appear to drive the racial wealth gap simply because so few households, whether black or white, receive what could be considered “large” inheritances (Hendricks, 2001) … Typically, wealth takes a considerable amount of time to accumulate, and so it could be many years before a household has a high level of wealth even if it earns a high income now. Thus, the degree to which labor income should be related to wealth over a short time horizon is not clear … The key policy implication of our work is that policies designed to speed the closing of the racial wealth gap would do well to focus on closing the racial income gap … [S]ocial scientists since Wilson (1997) have focused on the role of factors such as deindustrialization, neighborhoods, and schools in the persistence of the racial income gap.
As the authors of The Myth of American Inequality point out:
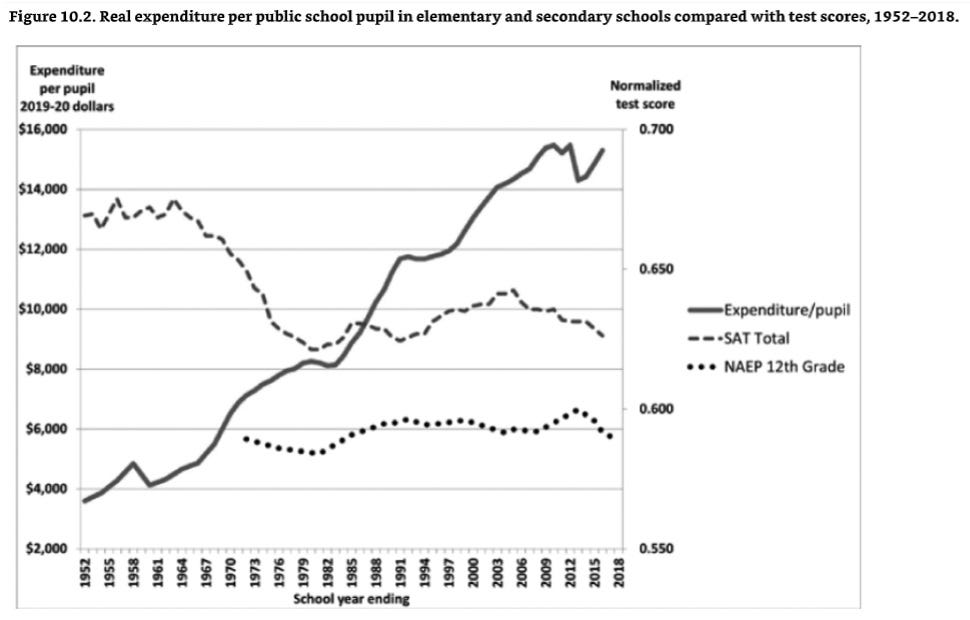
The failure of public primary and secondary education, especially in inner-city schools, has become a major impediment to educational and economic opportunity … The National Assessment of Educational Progress (NAEP) test in reading and mathematics is administered periodically by the US Department of Education to a large statistical sample of public schools across the nation. The “proficient” achievement level “represents solid academic performance for the given grade level.” The test results are a stark indictment of the failure of America’s public schools. Only one-quarter of high school seniors are proficient in mathematics and only one-third in reading. Even more startling is that the proficiency in mathematics actually declines the longer the child is in school. On average, attending school longer appears to increase the gap between what is actually being learned and the standard expected by grade level. Sending more people to college is not the solution because these data show that even among those headed to college, many still lack proficiency in high school skills. In fact, such poor preparation for college often increases the probability of failure in college or at least reduces the economic value of the education received … A long-standing excuse for the deficiencies in public education is that we do not spend enough money. But that narrative is false. Figure 10.2 shows that from 1952 to 2018, the real average expenditure per pupil rose by 343.9 percent. Since these are in inflation-adjusted dollars, that means that on average every elementary and secondary student in 2018 had 4.5 times as many resources provided for their education as students did in 1952.
Performance on the Scholastic Aptitude Test (SAT) was essentially unchanged for a dozen years beginning in 1952, but then it dropped by 8.0 percent from 1963 to 1980. Inflation-adjusted expenditures per pupil rose 83.8 percent during the seventeen years. Has there ever been a more tragic waste of money, spending almost twice as much per pupil and getting 8.0 percent less education in return? Over the next thirty-six years, the SAT scores hardly improved at all, regaining less than 10 percent of the score they had lost, while real expenditures per pupil nearly doubled again. … International comparisons reinforce these findings. The United States spent 38.2 percent more per student than the average of all developed nations in the Organisation for Economic Co-operation and Development, adjusted for cost differences among countries. Yet it ranked thirty-first out of thirty-seven in mathematics performance by its students. In reading, it ranked ninth. All eight countries that performed better than America in reading spent less on education per student, averaging 27 percent less … Education reform is difficult politically because the public school system is the largest employer in many American counties. School boards, superintendents, and teachers’ unions are well organized, well funded, highly centralized, and powerful not just in local government but also in the nation’s state legislatures and in Washington, DC. Education policy has become a typical political power play. On the one hand are the entrenched interests who view government-run schools as their domain, and maintaining control of them has become their major objective.
Another reason for a growing wealth gap is explained by Richard McKenzie in the Wall Street Journal:
[O]ne major cause of this wealth concentration is going largely unnoticed: Americans’ increasing life spans have disproportionately increased the elderly’s considerable wealth advantage. They’ve had more time to save and invest because of advances in medical science during their lifetimes. From 1940 to 2019, Americans’ life expectancy rose by almost 16 years, while the share of the U.S. population 65 and older grew from 9.8% to 16.7%. The elderly have progressively more healthy years to work. Most important, increased life spans have meant that older Americans’ wealth portfolios have been able to compound for longer. To illustrate, consider a 65-year-old today who has a portfolio of $1 million, fully invested in an S&P index fund, enabling him to hold off for years shifting assets into lower yielding bonds. Suppose he chooses to work an additional 10 years, expecting almost the same number of retirement years as a 65-year-old had in 1940, but all the while allowing the $1 million portfolio to compound for 10 years. If the S&P increases at its historical inflation-adjusted rate of 7.2%, his real wealth will grow to about $2 million—without any additional investments. The retiree will move from the top 12% of wealth holders to the top 6%. The person with $6 million at 65 will move from the top 3% to the top 1% at 75 … [C]ritics shouldn’t overlook that Americans 70 and up, who represent 16% of the population, now hold $35 trillion in wealth, or 27% of total wealth, up from a fifth three decades ago.
In the next essay in this series, we’ll look at the particular government benefits programs of Social Security and disability.


