In this essay, we’ll explore additional data on economic inequality, including additional common misconceptions.
Research shows that both self-identified “liberals” and “conservatives” greatly overestimate the difference between those in the lowest and highest income quintiles, with self-identified liberals greatly overestimating the difference.
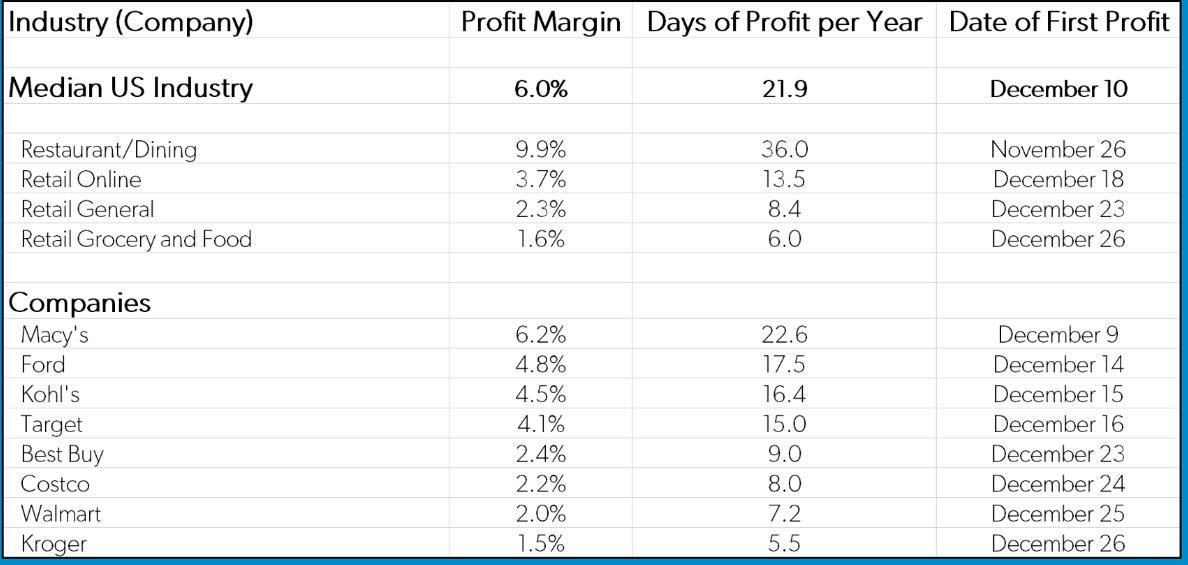
The American people generally also greatly overestimate the profit margins of private companies.
The median profit margin for American companies was 6% as of January 2018, whereas the general public thinks the average company makes a 36% profit margin.
As reported by Mark Perry, “only 10.4% of the Fortune 500 companies in 1955 have remained on the list during the 66 years through this year, and nearly 90% of the 1955 Fortune 500 companies have either gone bankrupt, merged with (or were acquired by) another firm, or they still exist but have fallen from the top Fortune 500 companies (ranked by sales revenues) in one year or more.”
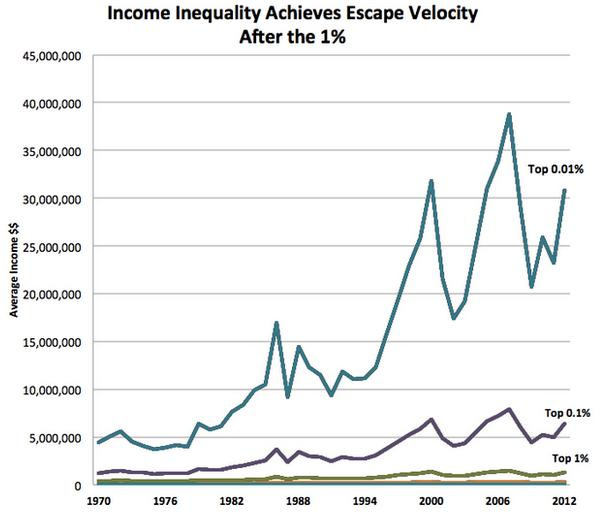
When one looks at the wealth gains made by the “top 1%” it turns out that most of the people in that category are not growing their share of wealth at all, but rather it is the top 0.1% whose comparative wealth is growing (and that group is comprised mostly of people riding the stock market to pick up extraordinary investment income, rather than ordinary earned income).
In 2020, Princeton’s Owen Zidar, Chicago Booth’s Eric Zwick, and Treasury’s Matt Smith found the increase in wealth among the top 0.1 percent over the past 40 years is half as large as previous estimates: a rise to 14 percent in 2016 from 7 percent in 1978.
The increase in CEO compensation can be explained in good part as a side-effect of regulation, namely increased compensation disclosure requirements by the Securities and Exchange Commission. As one CEO explained: “No board that isn’t about to fire its CEO really wants to admit that their CEO is a less-than-average performer [or an unproven but promising performer] by paying him or her less than average. But if the lowest-paid CEO’s are always being brought up to the average, then the average increases every year. Then for the high performers to be paid well, their compensation needs to be increased, but that raises the average … and so on every year.”
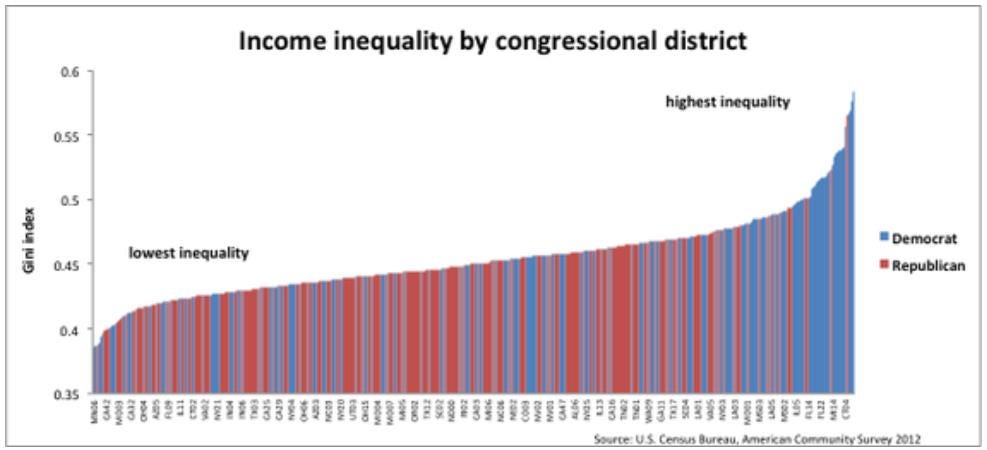
Incidentally, and contrary to some popular belief, the wealthiest districts, and also the districts with the starkest income inequality, tend to be represented by Democrats, not Republicans.
During the first 11 quarters of the Trump Presidency, “wages for the bottom 10% of earners over age 25 rose an average 5.9% annually compared to 2.4% during Barack Obama’s second term, according to the latest demographic data from the Bureau of Labor Statistics. Wages for the middle two quartiles increased 3.2% compared to 2.2% and 2.7% between 2012 and 2016. Wage gains for the top 10% have held steady at about 3%. Less educated workers have also seen the strongest gains. Wages have risen at a 6.1% annual clip for workers over 25 without a high school degree and 3.9% for those with some college—both about three times faster than during the second Obama term. Wage gains have also accelerated though to a lesser degree—to 3.2% from 2.2%—for college grads.”
In 2020, the Federal Reserve found that wealth inequality declined between 2016 and 2019, stating “families at the top of the income and wealth distributions experienced very little, if any, growth” in net worth between 2016 and 2019 “after experiencing large gains between 2013 and 2016,” while “families near the bottom of the income and wealth distributions generally continued to experience substantial gains.”
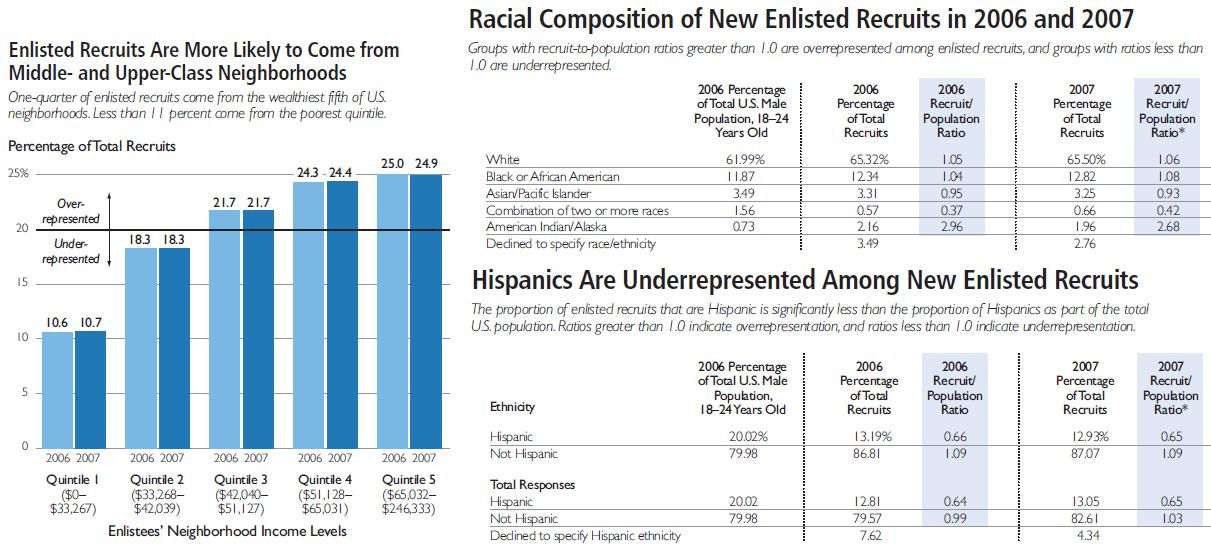
Income inequality also does not appear to affect military enlistment rates in that people from higher-income neighborhoods are overrepresented in the military.
As reported in the New York Times: “The South, where the culture of military service runs deep and military installations are plentiful, produces 20 percent more recruits than would be expected, based on its youth population. The states in the Northeast, which have very few military bases and a lower percentage of veterans, produce 20 percent fewer. The main predictors are not based on class or race. Army data show service spread mostly evenly through middle-class and “downscale” groups. Youth unemployment turns out not to be the prime factor. And the racial makeup of the force is more or less in line with that of young Americans as a whole, though African-Americans are slightly more likely to serve. Instead, the best predictor is a person’s familiarity with the military.”
In the next essay in this series, we’ll look at data on income mobility generally, and in relation to race.


Paul, you were in DC for a long time (perhaps still there). This data is clear and incontrovertible, really. As is most of what you post. Why is it ignored by virtually everyone? Has it become true that shouting lies loudly enough to get elected now routinely overrules the truth? And what about those who should be ahead of the curve just be saying what is true?
I have some personal sensitivity on this being similar to the whole covid thing (when covid began I was Chief Scientific Officer of a very large health care organization). I routinely noted that everything people said or did was likely wrong and that we should be thinking differently. (And I was generally completely correct.) But no one was interested in facts, the truth, or anything close. It still causes my head to spin Exorcist style.
But one can posit the covid mess to a time-limited toxic mix of power seeking on behalf of a few and fear on behalf of many. The economic issues you discuss have long trajectories over which to view the facts. If I were a Republican, for instance, I would be dragging your work out daily to show what ACTUALLY is going on.
But you were there. Just interested in any thoughts you might have. My head is going back to Exorcist mode, the more of this I actually see as clearly as you present it.
Thanks