Mismeasuring Economic Inequality – Part 15
More data on government benefits and their discouragement of work.
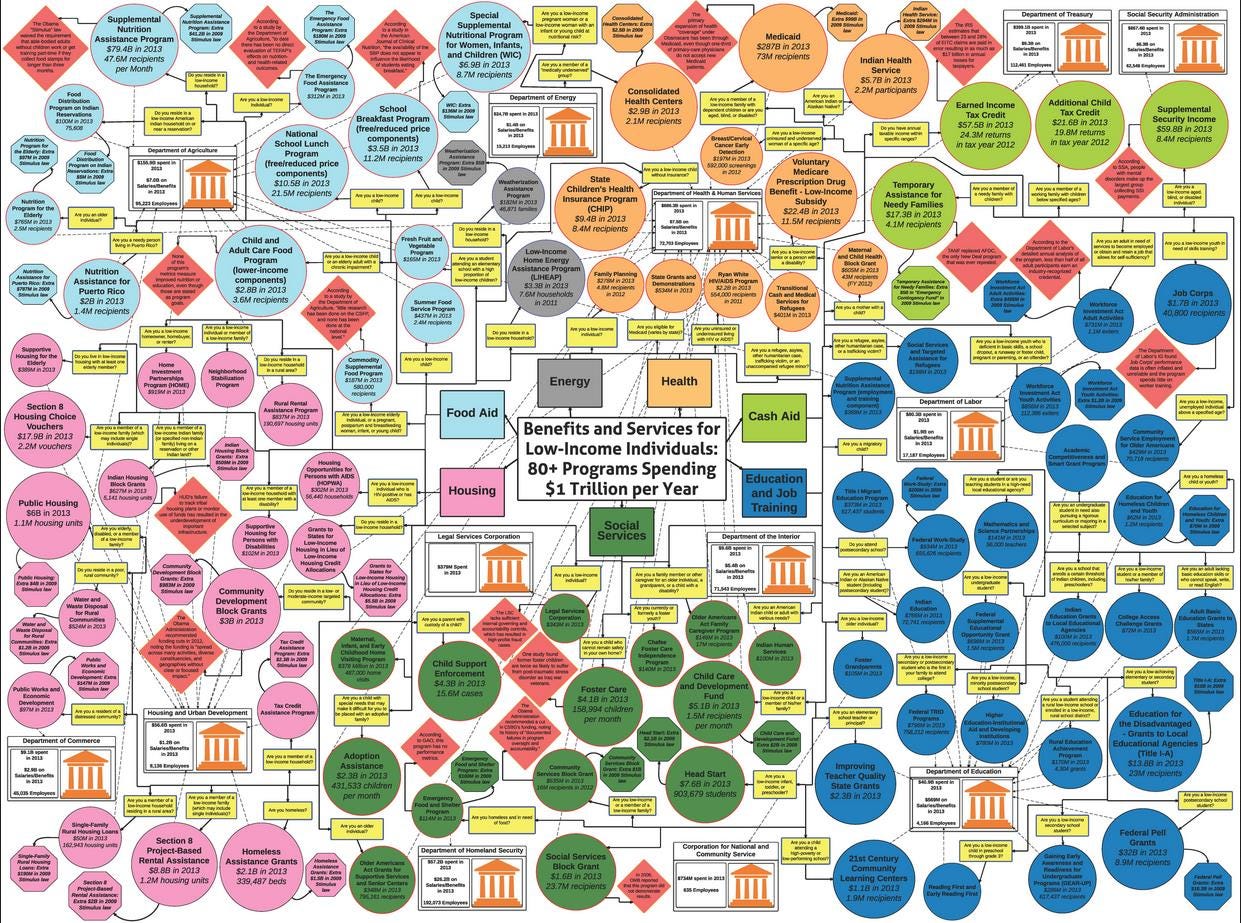
The following graphic shows the large array of federal programs available to low-income individuals and families, and the large bureaucracy necessary to support them.
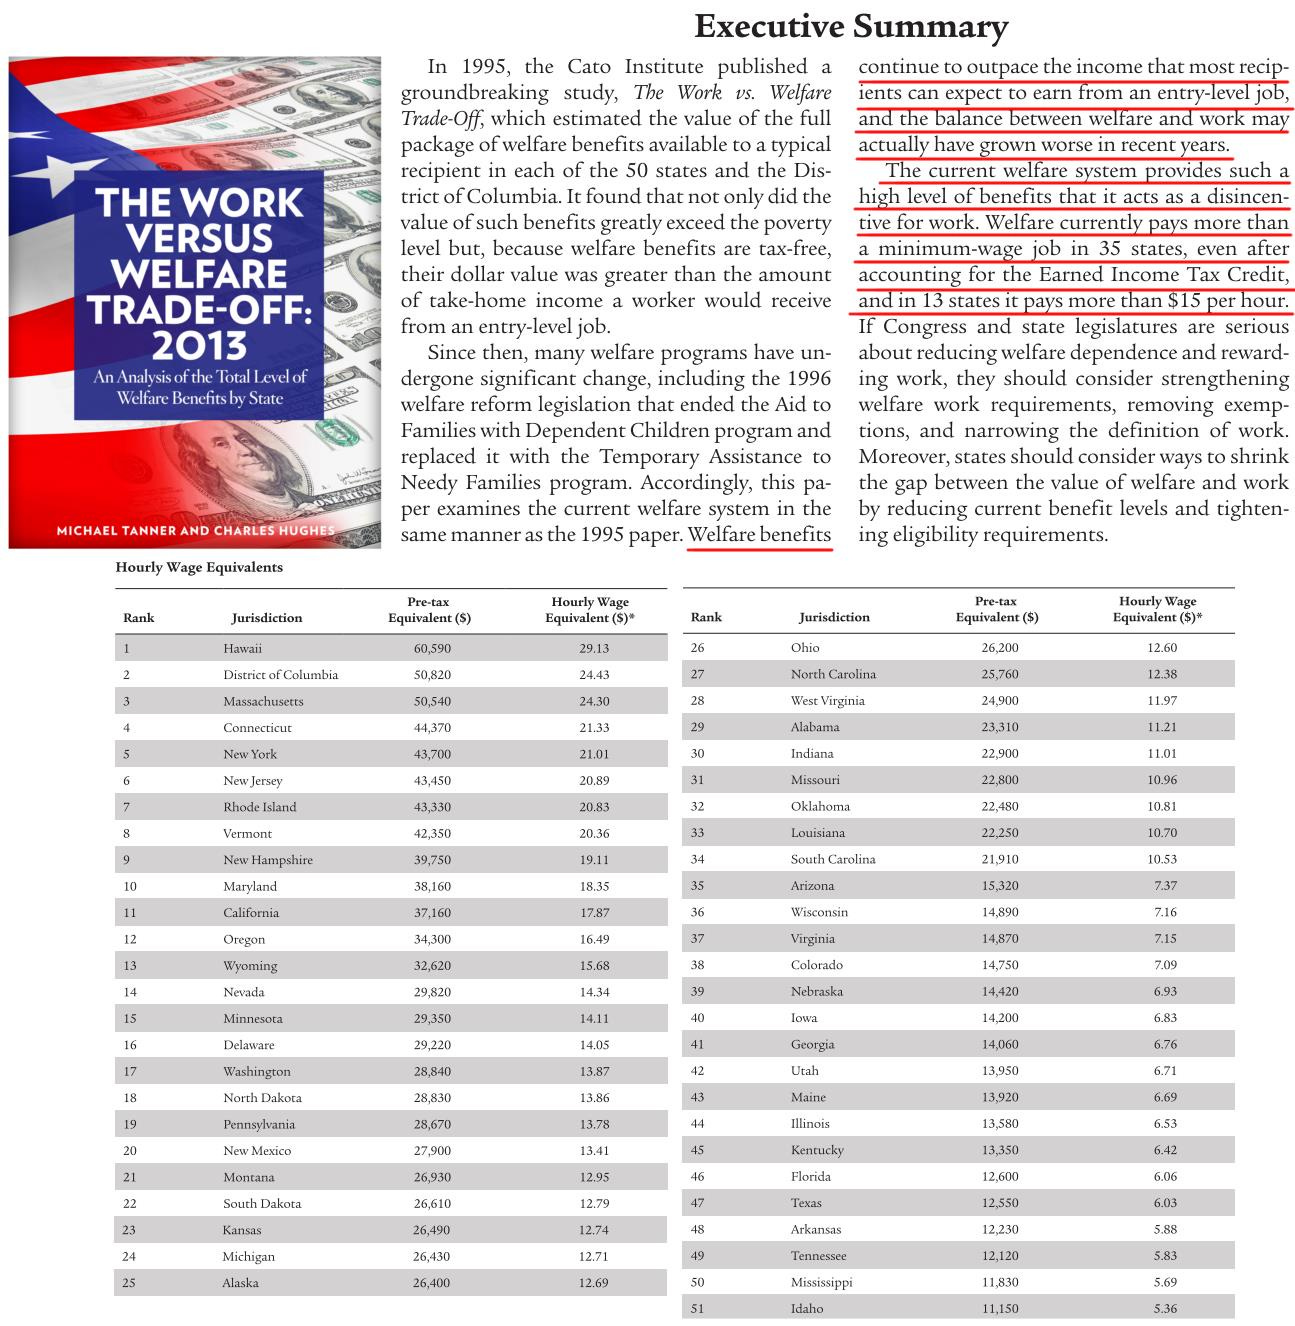
Thirty-five states offer welfare packages more generous than the mean benefit package offered in European countries.
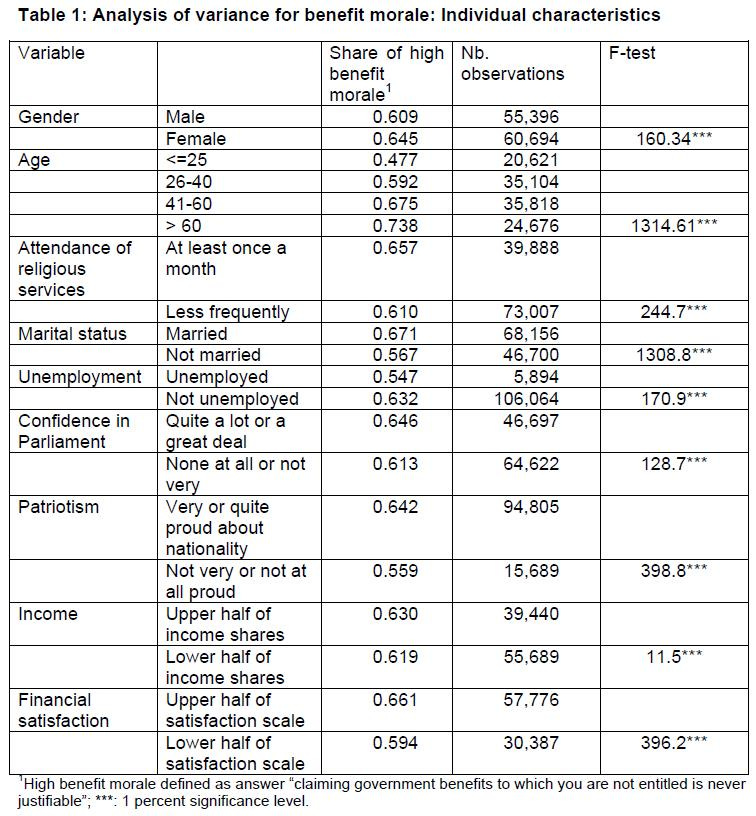
Research shows that, based on decades of survey data, increased welfare spending over time is correlated with an increased willingness on the part of people to claim benefits without justification. As the researcher concluded: “transfer expansion or increasing unemployment tend to be associated with a larger readiness of the country’s population to cheat on benefits.”
(A reluctance to claim benefits without justification is positively correlated with age, attendance of religious services, marriage, and patriotism.)
As of 2013, the welfare system paid more than a minimum-wage job in 35 states, making taking those jobs much less attractive.
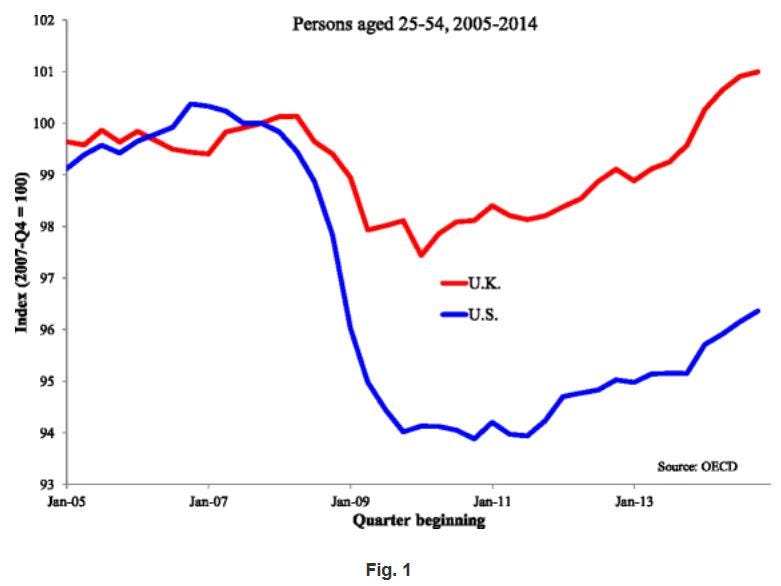
University of Chicago economist Casey Mulligan concludes that in response to the recession, several U.S. safety-net programs changed in ways that discouraged employment. Unemployment insurance, for example, was made more generous in multiple ways. Eligibility rules for food stamps were reduced, waivers from work requirements were granted, and the monthly benefit amount was increased. The U.K.’s fiscal “stimulus” took a very different path. Increases to benefit programs were smaller and largely involved cutting tax rates on income and consumption. To encourage more low-income individuals to work, Work and Pensions Secretary Iain Duncan Smith reformed the disability program to make more accurate and frequent assessments of recipients’ ability to work, and imposed benefit caps. The result is that many more people rejoined the labor force after the recent fiscal crisis in the U.K. than they did in the U.S.
The chart below shows the effect of various federal policies on workers who make a median income in terms of what percent of their earned income the workers actually get to keep. As the author of the analysis writes: “look at what people keep, on average, when they decide to retain or accept a job, or to take on a longer work schedule. Before the recession, a decision to work would benefit public treasuries by an amount equal to 40% of the compensation from the job. The worker and his family got the other 60%. In the years 2015 and beyond, full-time workers with median incomes will keep only half of the compensation created by their decisions, with the other half going to the government in the form of additional taxes and savings on subsidy payments. By keeping 50% rather than 60%, workers will find that the reward for holding a job will have fallen a damaging 17%.” That will create an even greater disincentive to work going forward.
As reported in August, 2021, in the Wall Street Journal:
The Department of Agriculture (USDA) is increasing benefits by an average of 27% over pre-pandemic levels under the guise of updating its Thrifty Food Plan. This is the basket of foods that the government uses to determine benefit size, which averaged $130 per person monthly before the pandemic. Benefits are adjusted annually for food inflation … Congress increased benefits by 15% during the pandemic, though this fillip is set to end in September. The Administration’s regulatory expansion will be permanent. A family of four will get up to $835 per month after adjusting for inflation. The average four-person household in the U.S. spent only $537 per month on food at home in 2019 … According to government data, food-stamp recipients spend about 20% of their allotment on sweetened beverages, desserts, salty snacks and candy. A 2018 study in the Journal of the American Medical Association examined diet quality of food-stamp beneficiaries and similar low-income individuals who didn’t receive the handouts from 2003 to 2014, a period in which average benefits increased more than 50%. Low-income food-stamp non-beneficiaries ate more healthily than beneficiaries, and their diets also improved more over time.
As Robert Doar has summarized:
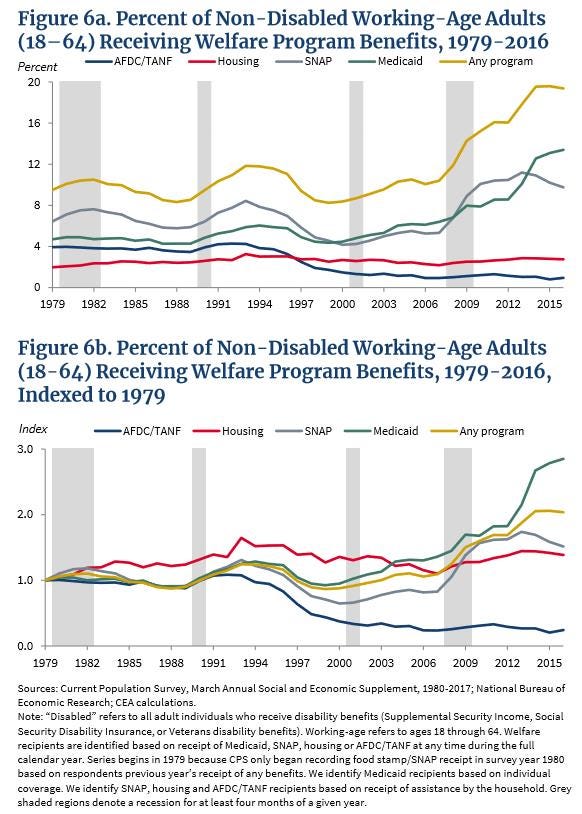
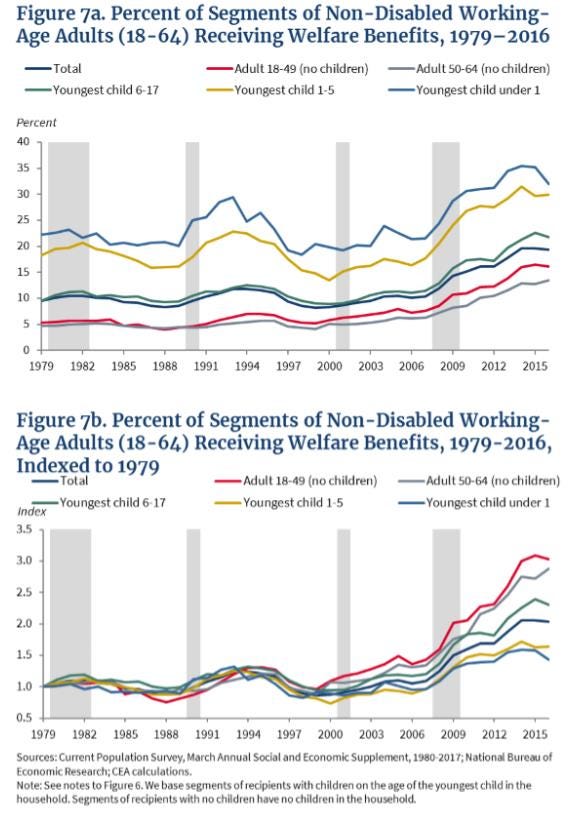
The president’s Council of Economic Advisers (CEA) has a new report out on the relationship between large welfare programs and work, which echoes many of the themes I learned while administering such programs in New York City. First, it identifies a fairly large group of non-disabled working age adults who receive various government benefits but do not work at all, though they could — and if they did, they would be significantly better off. The number of such people in Medicaid, for instance, is about 9.1 million. What’s more, 55 percent of non-disabled Medicaid recipients ages 18–49 and without children do not work at all, a higher rate of non-work than for adults with a child between the ages of 1 and 5. Think about that for a moment — Medicaid recipients who are parents of children under 6 are working more than Medicaid recipients who are not parents at all. And if just half those 9.1 million people rejoined the labor force, the frustratingly low labor force participation rate would spike to 65 percent — our highest rate in eight years. (Every additional million people in the labor force would increase the rate by 0.4 percentage points.) The numbers are just as stark when it comes to the Supplemental Nutrition Assistance Program (SNAP, or food stamps), which provides benefits to more than 10 million non-disabled working-age adults who do not work at all. A staggering 60 percent of SNAP recipients ages 18–49 with no children do not work, a rate 3 percent higher than the rate of non-work for SNAP recipients with infants. These statistics mean that even in good economic times, with jobs available, millions of Americans have dropped out of the labor force and are being supported by a safety net which makes little effort to help them escape poverty by getting a job.
Relevant charts from the report are presented below.
As a comparison, most people report escaping poverty in other countries based on their own initiative. According to researchers:
As part of a massive exercise of participatory assessment of how people’s well being had changed over a 10 year period, we held village meetings in 14 countries and three states of India (Narayan, Pritchett, Kapor 2009). In a ranking exercise people ranked the level of living of households today and their level 10 years ago. This identified almost 4000 people who, by their village neighbor’s assessments, had moved out of poverty. We then interviewed them and asked them what they thought the primary reason for their move out of poverty was. This is of course subject to all the subjectivity biases about how people narrate the story of their lives but 87.7 percent of them reported their own initiative (60.1 percent an initiative outside of agriculture, 17.4 percent in agriculture, 4.7 percent accumulation of assets, and 5.5 percent hard work). Only .3 percent (12 people of 3,991) who moved out of poverty named NGO [non-governmental organization] assistance as the cause.
This concludes this series of essays on mismeasuring economic inequality.







Paul, I have learned more from this series than in all my years of casually following us economics and social policy. Many, many thanks. Why this does not get far more attention I find inexplicable (both the subject and your work). My deep gratitude for making us all smarter.