In this essay, we’ll look at the particular government benefits programs of Social Security and disability.
As Phil Gramm, Robert Ekelund, and John Early write in their book The Myth of American Inequality: How Government Biases Policy Debate:
The Social Security system grants disproportionately higher benefits to low-income workers for every dollar they paid in taxes. The net result is that Social Security retirement benefits, relative to Social Security taxes paid, are five times greater for low earners than for high earners. The impact of Medicare benefits on reducing income inequality is even more pronounced because every Medicare beneficiary receives the same hospitalization insurance coverage (Part A), irrespective of the amount of income they earned and Medicare taxes they paid while working. As a result, in 2017 on average, bottom-quintile earners received a Medicare hospitalization benefit twenty-three times larger relative to the taxes they paid than was received by top-quintile earners.
As reported in the Wall Street Journal:
Americans may be richer than they think and less unequal than they’ve been led to believe. That’s the takeaway from a recent working paper by five economists from the University of Wisconsin and the Federal Reserve, which adds to standard wealth measures by including Social Security and pension guarantees. Social Security benefits and defined-benefit pensions—employer pensions promising a fixed income in retirement—don’t show up in workers’ bank accounts, but their promised future payouts are worth trillions of dollars. Include the full present value of retirement assets, the paper shows, and the median American household headed by someone in his or her 40s had a net worth in 2019 of $402,000. At the 75th percentile, the figure was $1.15 million. That makes a big difference for wealth inequality. As the authors write: “Our estimates show that the value of DB pensions and Social Security are significant relative to other forms of wealth—throughout the wealth distribution but especially at the lower half of the wealth distribution.” There are strong reasons to include pension and Social Security guarantees in wealth calculations. Most workers forfeit 12.4% of their income annually in payroll taxes in return for Social Security payouts starting in their 60s, but that wealth is ignored in standard inequality measures. If it weren’t for Social Security and pensions, workers would need to save more, and have less disposable income, to secure the same future standard of living … This study follows a 2020 paper from three University of Pennsylvania researchers that found an even greater impact of Social Security on inequality trends, using a different methodology and sample. They write that “Social Security promises rose in value by over 200 percent in real terms between 1989–2016.” Include Social Security in wealth calculations, and there has been “either only a minimal increase in the top 1% share,” the paper found, “or even a decrease.”
Regarding the federal disability assistance program, the authors of The Myth of American Inequality write:
Disability transfer payments under Social Security were made to individuals in 9.8 percent of all nonsenior households … Since 1972, eligibility standards for disability benefits have been systematically loosened, causing the number of disability beneficiaries to rise more than five times faster than the working population and increasing the redistribution of income from working individuals to those receiving disability benefits. This increase in disability transfers has occurred despite a sharp decline in work-related injuries, medical advances enabling more individuals to overcome their disabilities, and the Americans with Disabilities Act requirement for employers to make much greater accommodations for workers with disabilities.
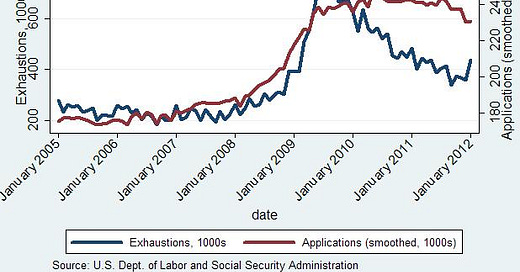
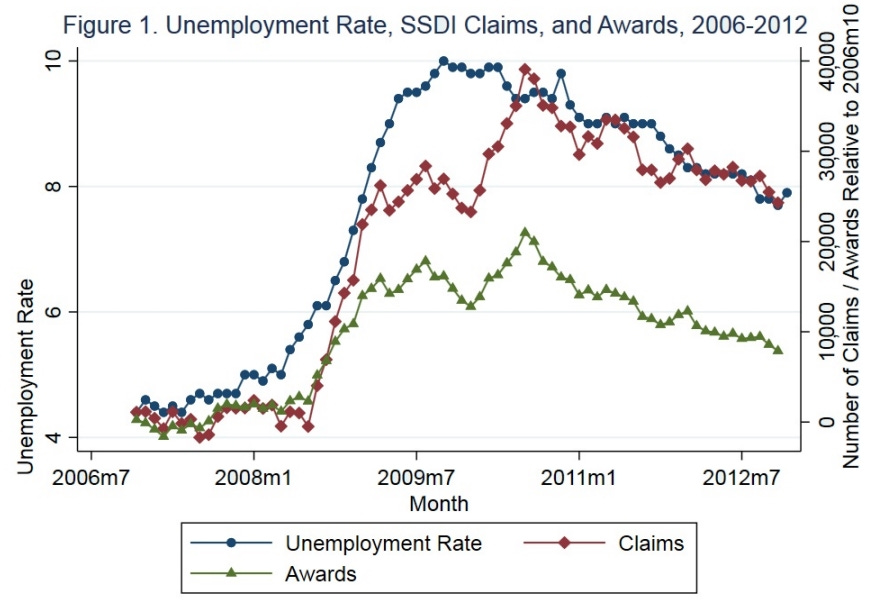
During the recession of 2007-2009, as more federal unemployment benefits have reached their time limit for individuals, applications for Social Security disability insurance have increased, and remained increased.
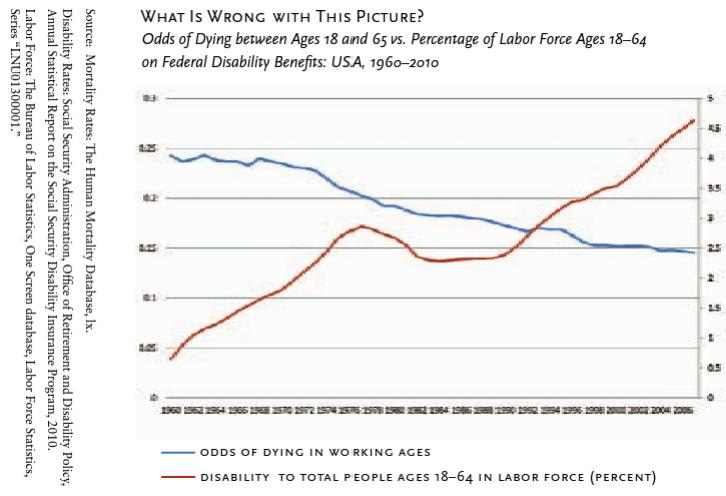
Despite the better general health of today’s workforce, the percentage of the labor force on federal disability benefits has increased dramatically.
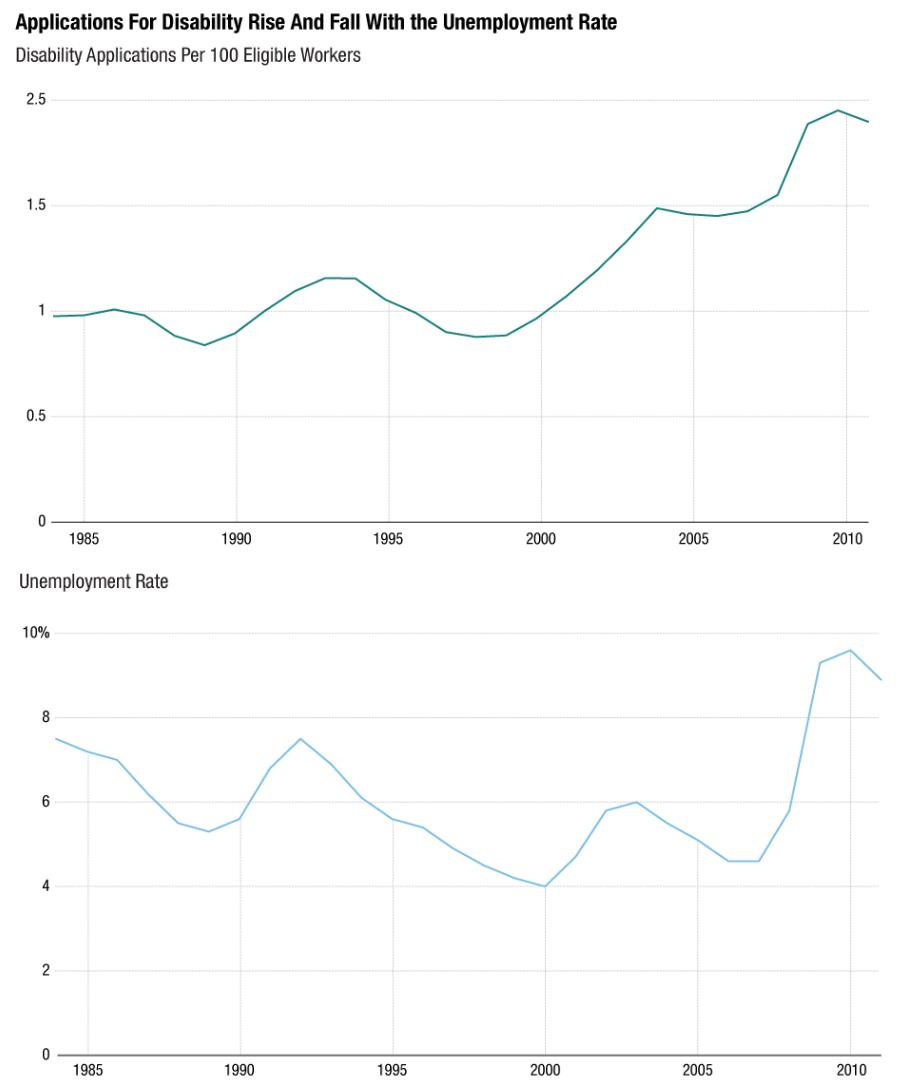
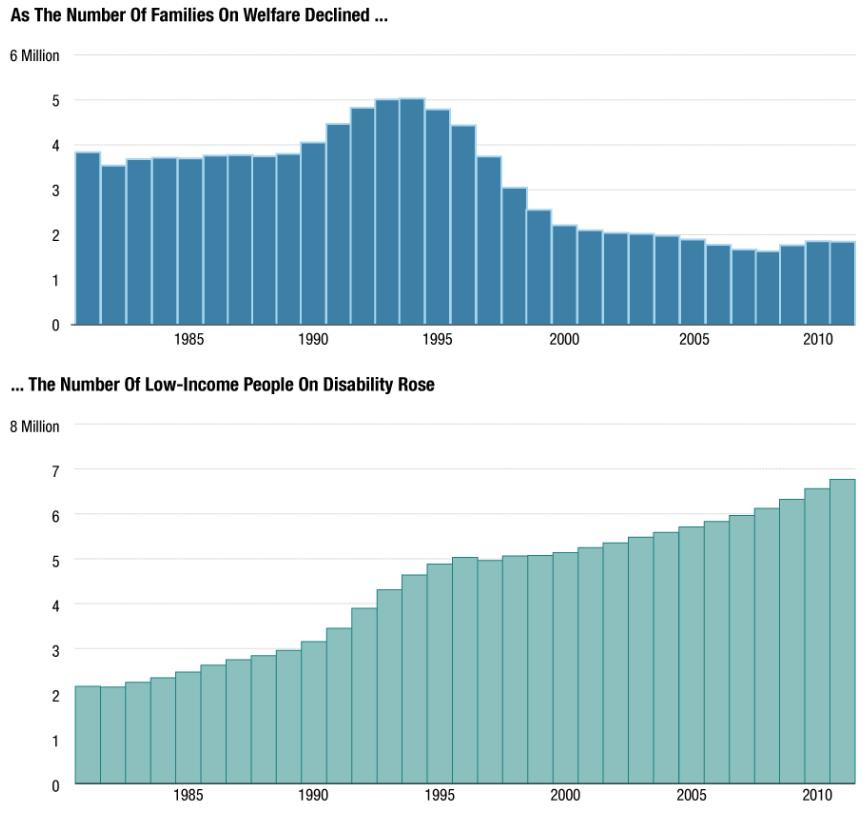
More generally, going back many years, applications for federal disability payments have risen and fallen along with the employment rate (indicating many people are using disability benefits as a substitute for unemployment benefits), and increasing numbers of family members are transitioning from welfare to disability.
The ratio of those on disability to active workers significantly increased following the 2007-2009 recession.
The disability termination rate has also gone down over time while disability benefits have gone up.
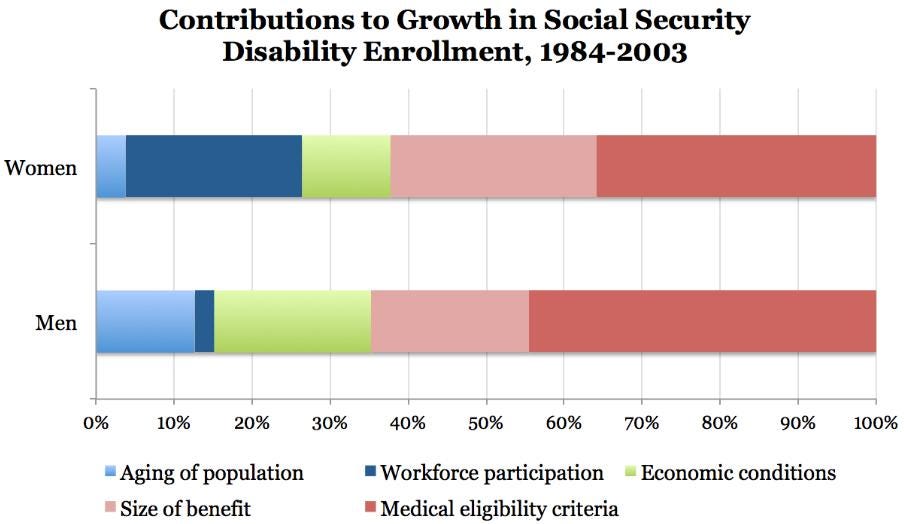
Only 13 percent of the growth in the receipt of disability benefits in men and 4 percent of the growth for women (who only recently entered the workforce in large numbers) was due to the aging of the population. Most of the growth is the result of relaxed disability eligibility criteria.
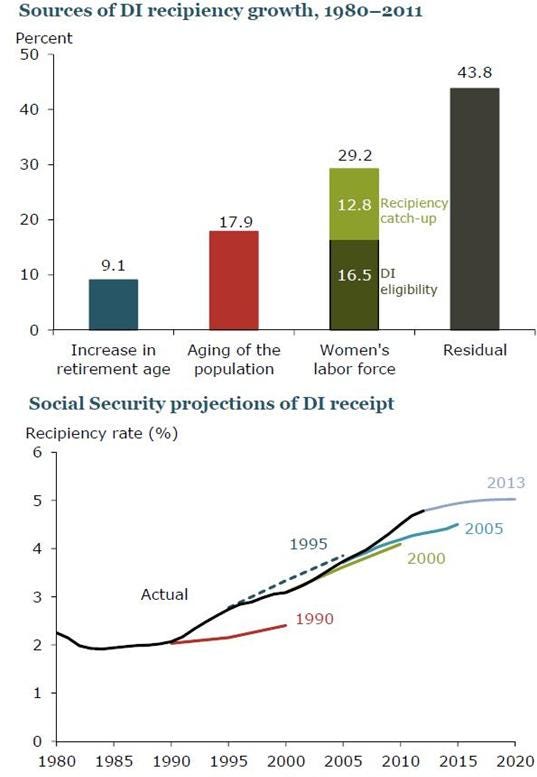
Research by the Federal Reserve Bank of San Francisco estimates that over 40 percent of the growth in disability claims in recent decades is a result of the program’s attracting a broader beneficiary base. It notes that it has become easier to qualify, as claims increasingly are judged on subjective criteria that are difficult to disprove. And the benefits have become more lucrative, particularly for low-wage workers. (The benefits formula is based on average wages, so rising income inequality has increased benefit payments even as the wages of most workers have stagnated.) The Social Security Administration has also consistently underestimated the growth in the disability recipience rate in recent years.
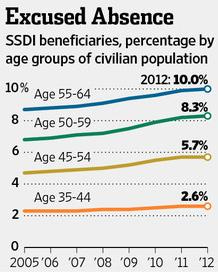
More people in their 30’s and 40’s are increasingly going on disability.
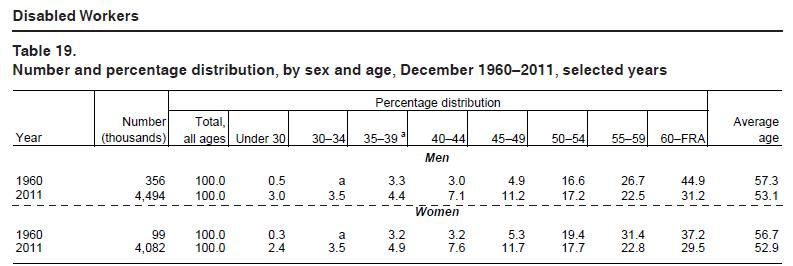
There has been a gradual reduction in the age of those receiving disability payments over time. In 1960, for example, 6.3 percent of men and 6.4 percent of women on disability were in their 30’s or 40’s. By 2011 the shares were 15 percent and 16.2 percent, respectively.
The leading diagnostic categories under which disability claimants are awarded federal stipends today are “mood disorders” (15 percent, or 1.3 million) and “musculoskeletal system and the connective tissue” (29 percent, or 2.5 million).
Together these categories make up nearly half of all disability diagnoses today. In 1960, such categories, and all mental disorder categories combined, accounted for less than one-fifth of disability awards.
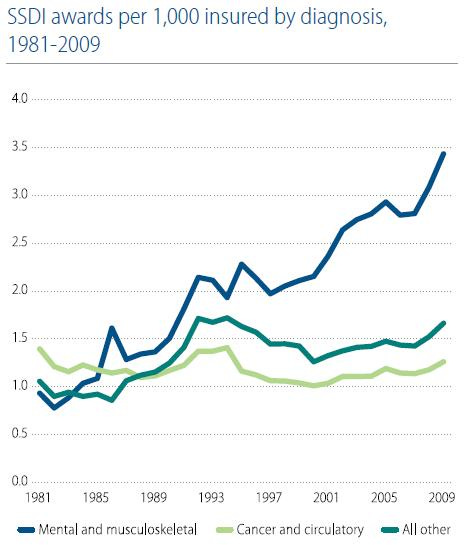
Mental and musculoskeletal diagnoses have risen dramatically in some recent years, whereas other diagnoses have remained relatively flat. As one researcher found:
For both males and females, the incidence of circulatory- and cancer-related benefit awards has been falling, while the incidence of musculoskeletal and, to a lesser extent, mental conditions has been rising. One possible interpretation of these trends is that overall health has been improving as reflected in the declining circulatory and cancer incidence rate, but that improving health has not produced declining incidence rates because the program has become more lenient in approving claims for musculoskeletal and mental conditions. Using my simulation model, I find that if the incidence rates for musculoskeletal and mental benefit awards had remained constant at their 1985 levels, while all other conditions followed their actual path, the beneficiary ratio would have been 21 percent lower in 2007 than it was.
Research shows that the most marginal disability recipients are those most likely to claim a mental disorder that is particularly difficult to assess, be younger, and have pre-disability earnings in the lowest earning quintile. Disability benefits, as currently administered, discourage work by those who can work. As this research demonstrates, the employment rate of these marginal program entrants would have been 28 percentage points higher if they did not receive disability benefits.
As Ernie Tedeschi points out, “Prime-age (25-54-year-old) employment is growing at a pace of around +750,000 a year. Almost a third of these job finders are coming from the ranks of the disabled -- the single biggest source of new worker hires,” meaning as the economy is getting better fewer people (mostly women) are leaving the disability rolls.
Here is the same chart broken up by sex:
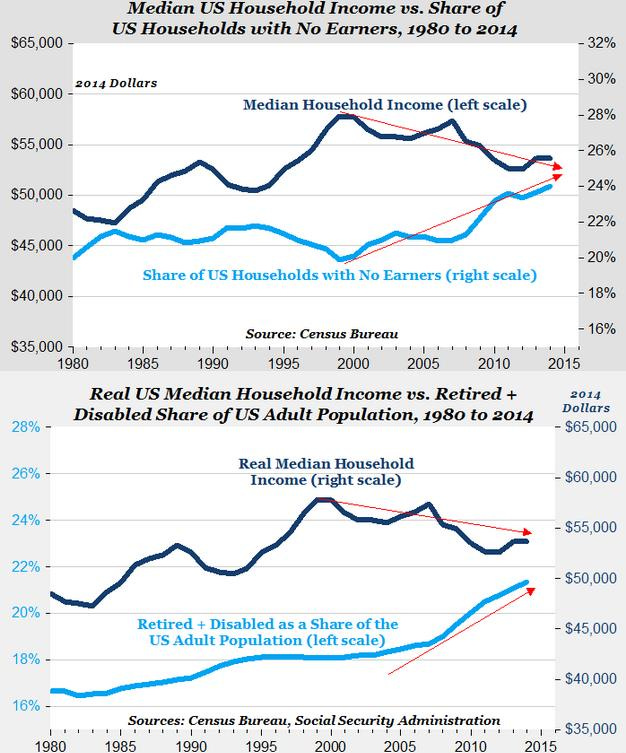
Real median household income has been declining, but that is largely explained by the increasing number of retirees, and also an increasing number of those categorized as disabled.
The expansion of benefit criteria -- and not increases in poverty or decreases in health -- have also led to many more children receiving federal disability benefits. And once people receive those benefits as children, they overwhelmingly continue to receive them as adults (and do not enter the workforce).
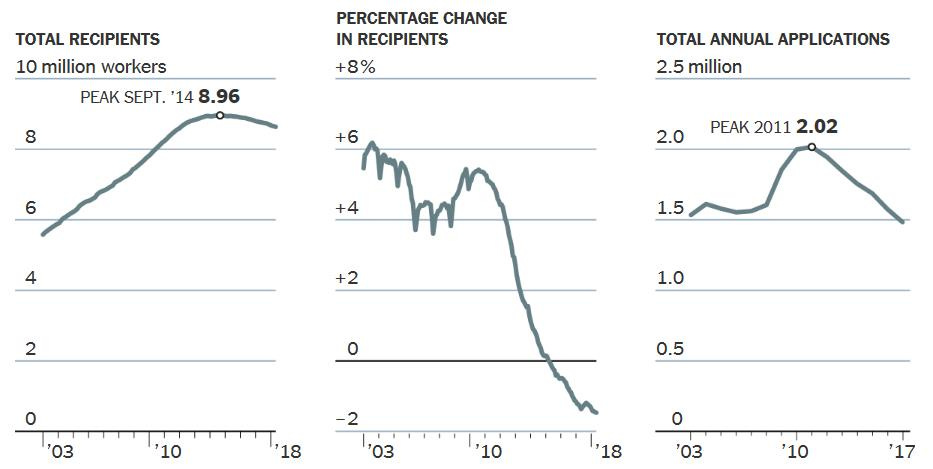
This trend reversed to some extent with an improving economy (and employment among the disabled also improved somewhat as telework became more readily available during and following the COVID-19 pandemic). As reported in the New York Times in 2018, “The rise in the number of Americans not working because of disability was so persistent for two decades that some economists began to hypothesize that the trend would never reverse. But perhaps it has. Since a peak almost four years ago, that number has steadily fallen, showing its largest decline — both in terms of head count and percentage — in at least the last 25 years … The data shows that the decline has come almost entirely from the older half of the prime-age population (that is, people between 40 and 54).” Still, “[a]t its recent pace of decline, it would take six to eight more years without another recession for the percentage of prime-age people not working because of disability to return to 2000 levels.”
Still, a study published in 2023 by Professors Maestas, Mullen, and Strand (MMS) published examining the effect of unemployment during the Great Recession (December 2007 to June 2009) and subsequent years on the number of claims to and awards for Social Security Disability Insurance (SSDI) show the relative ease many middle-age workers have in qualifying for disability benefits, even with lesser disabilities, because the rules presume their work experience and skills don’t transfer to other available work in the economy. The researchers looked at all SSDI applicants from 2006 through 2012 and tracked their outcomes through the appellate level. They estimated that the Great Recession led 1.4 million workers to apply for SSDI from 2008 to 2012, and that nearly three-quarters would not have applied but for the recession. The researchers also found that allowances for musculoskeletal and mental impairments particularly increased with unemployment.
In the next essay in this series, we’ll explore the role of charity in providing benefits to Americans.









Paul, I will continue to be a one man band for you. I learn a mountain from every piece you write. And I spread it as far as I can although this is not my space. So many thanks for doing this. Really amazing content.