Immigration – Part 2
Immigration and government benefits programs.
In the previous essay, we explored how a disproportionate number of illegal entrants into the United States tend to have relatively less education and fewer skills. People with less education and fewer skills tend to resort to relying on government benefits programs. The strain that surges in both legal and illegal immigration can place on government welfare systems has long been recognized. As Kirstin Downey writes in her biography of President Franklin D. Roosevelt’s Secretary of Labor, The Woman Behind the New Deal: The Life of Frances Perkins, FDR'S Secretary of Labor and His Moral Conscience:
“It is generally recognized that the United States can no longer absorb annually hundreds of thousands of immigrants without serious economic and social dislocations,” [Secretary Perkins] wrote. “Certainly the present restrictions can not be relaxed while millions of workers are unemployed and maintained at public expense.”
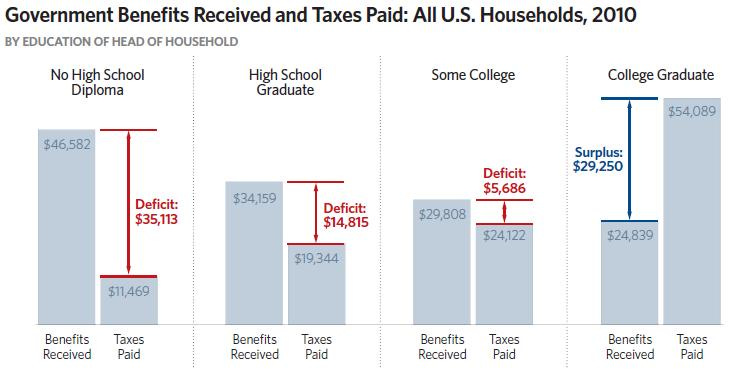
And in more recent times, households headed by those without a high school diploma tend to receive far more in government benefits than they pay in taxes.
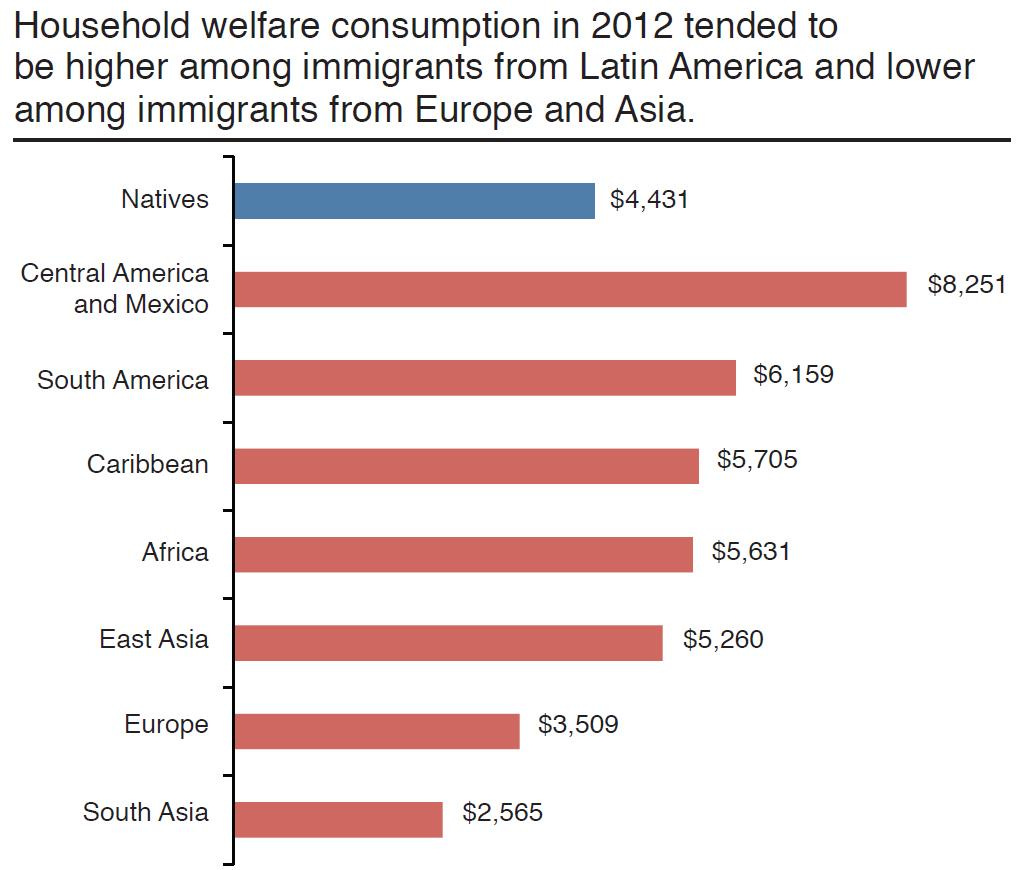
The percentage of immigrant-headed households using one or more welfare programs varies by sending region, with Central America and Mexico having the highest percentages.
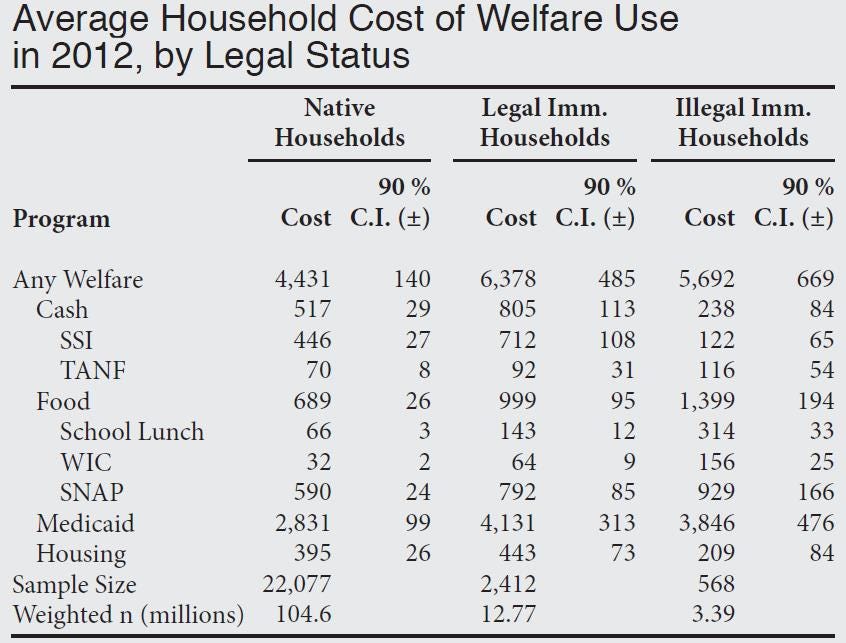
The annual federal welfare benefits costs of households headed by immigrants from Central America and Mexico (the highest costs of any sending region) were $8,251 in 2012, 86 percent higher than the same costs of native households ($4,431), a number explained in part by lower levels of education and larger numbers of children (who are allowed welfare benefits even when they are the children of illegal immigrants).
Illegal immigrant households cost an average of $5,692 per year in federal welfare benefits costs.
As George J. Borjas of Harvard University has written:
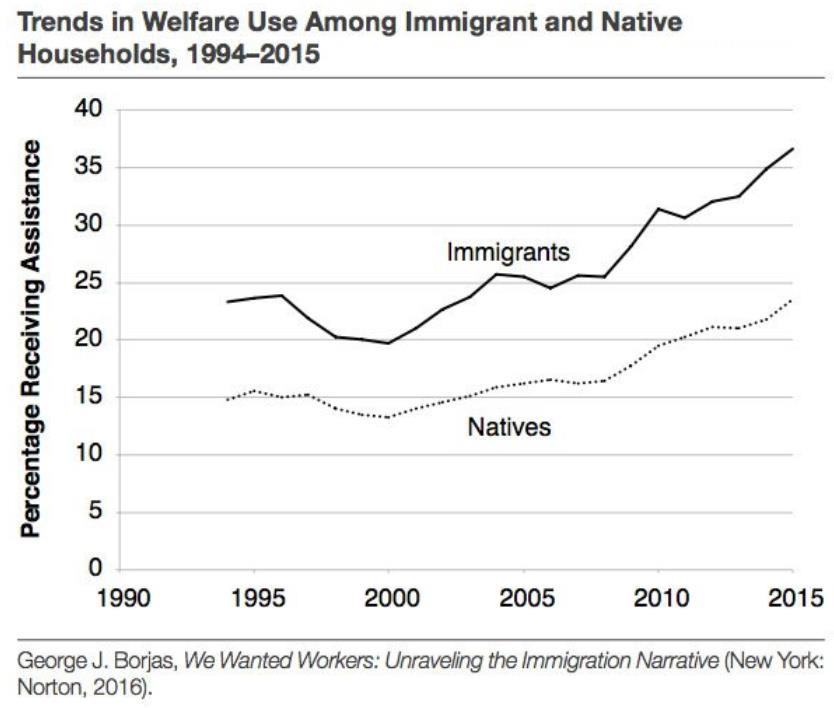
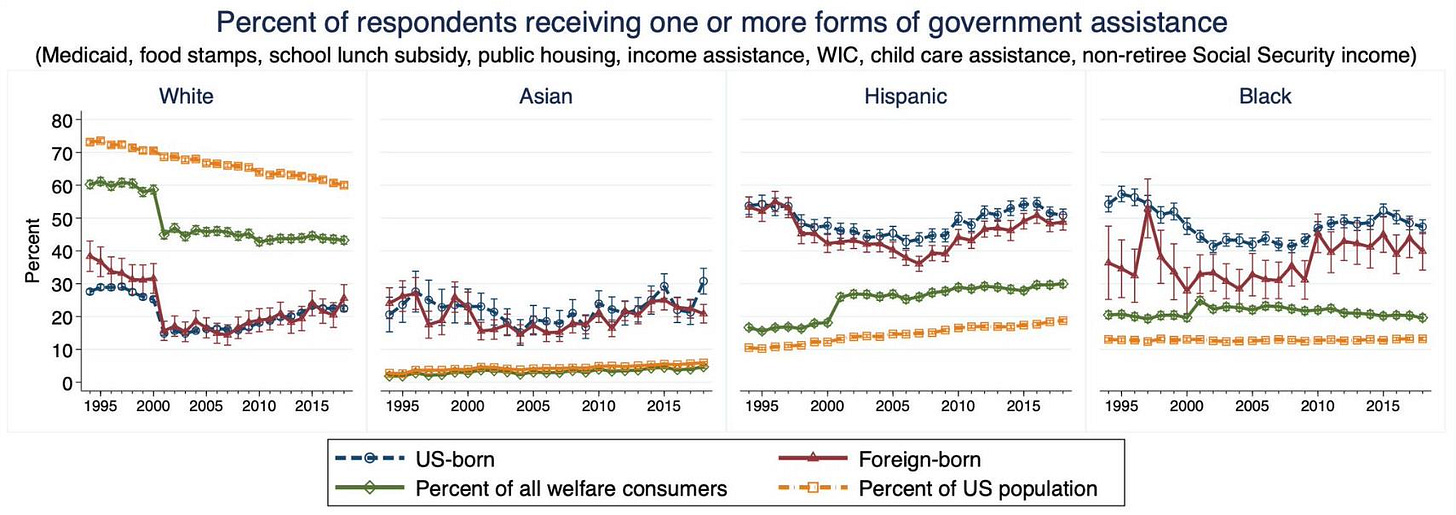
It turns out that despite [legal] restrictions, the ‘wall’ built around the welfare state does not seem to prevent many immigrants from qualifying for and receiving public assistance … It is easy to document the evidence showing that immigrants, and particularly low-skill immigrants, have very high rates of participation in welfare programs. The Current Population Survey (CPS) is the premier monthly survey of the American population and is conducted by the Bureau of Labor Statistics. The March survey solicits information on a person’s income in the previous calendar year, and on whether the person received particular types of public assistance. Since 1994, the CPS reports whether a particular person is foreign-born. To simplify the exposition, being ‘on welfare’ will mean receiving benefits from any one of three programs: Medicaid, food stamps, or cash benefits (which include Temporary Assistance for Needy Families, Supplementary Security Income, and ‘general’ assistance given by cities and counties to persons in short-term dire need). [The following chart] shows the trends in welfare use, reporting the fraction of households that receive some type of assistance. An immigrant household is one where the head of the household is foreign-born, and a native household is one where the head is native-born. Evidently, households headed by an immigrant have particularly high rates of welfare use, and the gap between immigrant and native households increased over time. By 2015, 37 percent of immigrant households were on welfare compared with only 24 percent of native households.
As Peter Beinart has written in the Atlantic magazine:
By some estimates, immigrants, who are poorer on average than native-born Americans and have larger families, receive more in government services than they pay in taxes. According to the National Academies report, immigrant-headed families with children are 15 percentage points more likely to rely on food assistance, and 12 points more likely to rely on Medicaid, than other families with children.
That 2016 report by the National Academy of Sciences on the economic effects of immigration shows that the average of all eight fiscal scenarios studied is a net drain (increased taxes received minus increased spending on public services).
In particular, when the National Academy of Sciences did its analysis of the impact of immigration over 75 years, which included second and third generations, it found the impact was negative for immigrants with just a high school education, and even more negative for immigrants with less than a high-school education.
In July, 2019, the Census Bureau released figures from the Current Population Survey that shows that foreign-born populations continue to receive disproportionately large shares of government assistance.
As Matt Weidinger at the American Enterprise Institute summarizes:
1. How many illegal immigrants are in the US and how many entered during the Biden-Harris administration?
“Recent estimates range from 10.3 million to 11.4 million unauthorized individuals living in the United States.”
“…the Biden-Harris Administration has released into the United States more than 5.6 million illegal aliens, with another 1.9 million illegal alien ‘gotaways’ escaping into the country…”
2. What is the total annual cost of illegal immigration?
“At the start of 2023, the net cost of illegal immigration for the United States – at the federal, state, and local levels – was at least $150.7 billion.”
3. How much are those costs per taxpayer?
“Illegal immigration costs each American taxpayer $1,156 per year ($957 after factoring in taxes paid by illegal aliens).”
“Each illegal alien or U.S.-born child of illegal aliens costs the U.S. $8,776 annually.”
4. How much are the costs over a lifetime?
“….using existing estimates of the net lifetime fiscal impact (taxes paid minus costs) of immigrants by education indicates that the fiscal drain created by the average illegal immigrant is $68,000.”
5. How does illegal immigrants’ benefit use compare with other households?
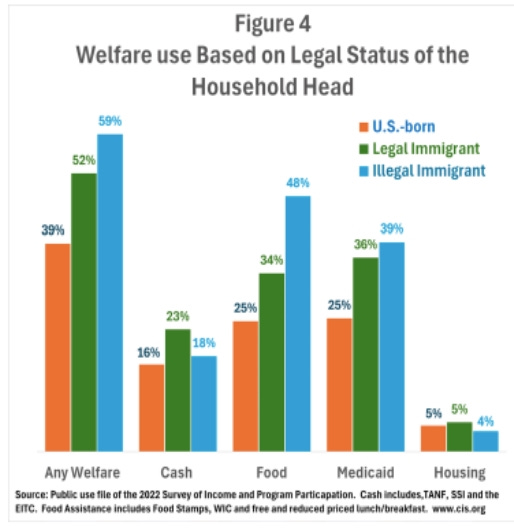
“We estimate that 59.4 percent of illegal immigrant households use one or more welfare programs. Compared to the U.S.-born, illegal-headed households use every program at statistically higher rates, except for SSI, TANF, and housing. Illegal immigrants have especially high use of cash (mainly the EITC), food programs, and Medicaid.”
6. How can illegal immigrant households collect so much welfare?
“The high use of welfare by illegal immigrant-headed households is due to several factors. First and foremost, more than half of all illegal immigrant households have at least one U.S.-born child on behalf of whom they can receive benefits…”
7. How many households with children are headed by illegal immigrants?
“…there are nearly 2.7 million households with at least one illegal head and one child….there are more than 5.3 million U.S.-born children of illegal aliens who hold SSNs.”
8. How much do these households collect in key federal food and cash benefits?
“…the total estimated cost to the American taxpayer of providing SNAP to the children of illegal aliens is almost $5.8 billion.”
“…the total cost for providing TANF benefits to the U.S.-born children of illegal aliens comes out to approximately $1.43 billion.”
“…illegal alien households received approximately $13.4 billion in child tax credits in 2022 for the 2021 tax year.” After the elevated child tax credit expired in 2022, this amount is expected to be “in the area of $5.4 billion going forward.”
9. How much do illegal immigrant households collect in federal health benefits?
According to the House Budget Committee, the $16.2 billion increase in Medicaid-funded emergency services for illegal immigrants under the Biden-Harris administration reflects an “increase of 124% compared to the same period under the Trump Administration.” As Chairman Jodey Arrington (R-TX) notes, “This is on top of the executive action taken to provide $9 billion in Obamacare to illegal immigrants.”
10. Did illegal immigrant households collect pandemic benefits supported by federal funds?
Yes. Democrats’ March 2021 American Rescue Plan provided states $350 billion in flexible federal funds, which some states used to provide unemployment checks to illegal immigrants: “[New York] just created a new $2.1 billion program for those living in the US illegally….funds from the new program will flow to 290,000 individuals across New York, including 92,000 who may soon receive $15,600 in a lump sum payment — the equivalent of $300 per week of unemployment in the past year. That’s for those who, despite not being authorized to work in the US, can prove they lost employment during the pandemic.”
Researchers at Penn State and Michigan State also found that “unauthorized immigration correlates with increased expenditures across multiple categories, including welfare assistance, construction, education, and law enforcement. The magnitude of these effects increases with immigration intensity, suggesting non-linear responses in public service demands. Importantly, these higher expenditures are not offset by corresponding increases in tax revenues or other government income sources.”
A 2025 analysis from the Center for Immigration Studies found that 47% of noncitizen households with children under 6 use the programs. For comparison, 31% of American citizen households use SNAP and WIC.
As Nicholas Eberstadt points out:
Daniel DiMartino of Manhattan Institute and David Bier of Cato Institute arrive at dramatically different estimates of the net fiscal impact of immigration by age and education of immigrant cohorts—even though their work commences at the same starting point and relies on the same data sources. Both agree, however, that migrants with no more than a high school degree, when taken as a whole, cost the country more in public benefits than they contribute in taxes …
This chart, derived from ACS 2022 data, highlights the striking differences in educational attainment for US immigrants from Latin America and those from the rest of the world. Immigrant adults from Latin America are over five times more likely to lack a bachelor’s degree than their native-born counterparts …
[W]e know that the overwhelming majority of today’s illegal immigrants to the US were born in Latin America and the Caribbean, and that illegal or conditionally protected immigrants account for about half of all New World immigrants in the United States today. We may reasonably infer that the educational profile of illegal entrants from Latin America is even lower than the average for the Latin American immigrant population.
This dynamic in which a large segment of the immigrant population disproportionately relies on government welfare programs manifests itself in politics as well. According Census figures summarized by Michael Barone in 2016: “The 23 Republican states have grown 5.1 percent in 2010-15, the 11 target [‘swing’] states 4.2 percent and the 16 Democratic states plus D.C. 3.2 percent. Republican states gained 2.3 million by migration, split evenly between immigration and domestic inflow. Target states gained 2 million, two-thirds from immigration and one-third from domestic inflow. In contrast, the Democratic states lost 1.8 from domestic outflow but gained 2.8 million immigrants -- more than half the national immigration total.” And according to a Pew Research Center survey in 2020, Hispanics are more generally supportive of “bigger government providing more services.”
Under the Trump administration, regulations were promulgated imposing tougher standards for aliens attempting to prove that they won’t become “public charges” in the United States. As stated in the Wall Street Journal:
Under the old guidelines, established during the Clinton era, only cash assistance or long-term institutional care could be considered strikes against applicants. Only a few hundred applicants were refused under the public charge provision world-wide each year. The new rules will allow immigration officials to consider noncash benefits such as food stamps, Medicaid and housing vouchers in evaluating whether an alien would be a public charge in the U.S. … The new restrictions don’t apply to immigrants who already have green cards, or to refugees and asylum seekers. Only applicants who have relied on welfare programs for an aggregate period of at least 12 months in the most recent three-year period will be considered potential public charges.
President Biden reversed those Trump-era guidelines.
The modern reliance of large swathes of immigrants to the United States on welfare programs today is in sharp contrast to what historians say motivated immigrants to the U.S. in the late 1800’s. The primary reason immigrants came to America between around 1870 to 1900 was for economic freedom, and this chart shows how immigration rates generally rose or fell along with the prosperity of the American economy.
Irish immigrant John Costello wrote to family from America in 1883, expressing a spirit typical of the thousands of such letters recovered from that time.
However, today, as wages for low-skilled workers are reduced by increased supply, there is an increased reliance on government welfare programs. A 2020 Congressional Budget Office report concluded that “Among people with less education, a large percentage are foreign born. Consequently, immigration has exerted downward pressure on the wages of relatively low-skilled workers who are already in the country, regardless of their birthplace.”
As Peter Beinart has written in the Atlantic magazine: “According to a comprehensive new report by the National Academies of Sciences, Engineering, and Medicine, ‘Groups comparable to … immigrants in terms of their skill may experience a wage reduction as a result of immigration-induced increases in labor supply.’” Indeed, famous labor leader Hugo Chavez made enforcement of border controls to prevent illegal immigration a central focus of his campaign to increase the wages of union members.
Reducing low-skilled illegal immigration boosts the wages of Americans who would do the same jobs. As reported in the Economist, in the wake of President Trump’s stricter border control policies:
In both 2018 and 2019 nominal wages rose by more than 3%, the fastest growth since before the recession a decade ago. Americans at the bottom of the labour market are doing especially well. In the past year the wages of those without a high-school diploma have risen by nearly 10%. Intriguingly, this has come as America has turned considerably less friendly to immigrants, who are assumed by many to steal jobs from natives and lower the wages of less-educated folk. The two phenomena may be connected … For the first time in half a century America’s immigrant population appears to be in sustained decline, both in absolute terms and as a share of the total. Net migration to America (ie, the difference between people arriving and people leaving the country) fell to 595,000 in 2019, the lowest in over a decade … The number of highly qualified immigrants continues to rise. San Francisco airport remains just as crammed with Allbirds-and-gilet-wearing tech investors from all over the world. It appears instead that the overall decline in the foreign-born population is a result of falling numbers of low-skilled migrants … That is probably a consequence of policies implemented by President Donald Trump … Gordon Hanson of Harvard University suggests that if the impact of reduced low-skill migration is showing up anywhere, it will be in three particular occupations: housekeepers, building-and-grounds maintenance workers, and drywall installers. These occupations rely heavily on immigrant labour and the services they provide cannot be traded internationally. Average wages in those occupations are rising considerably faster than wages in other low-paid jobs, according to calculations by The Economist. Intriguing evidence also shows up geographically. According to research by William Frey of the Brookings Institution, a think-tank, five big metro areas saw absolute declines in their foreign-born populations in 2010-18. Wages in those areas are now rising by 5% a year, according to our calculations.
In the next and last essay in this series, we’ll explore the connection between immigration, communication, and communities.





Paul, you publish some of the most impactful data all in one place. Most of what you put out here is irrefutable and should be read by everyone. Thanks for doing this. A true labor of love.